Competitive Intelligence Dashboard Guide: Setup, Data Sources & Tools
A competitive intelligence dashboard aggregates data on competitors from multiple channels into one live view: pricing pages, press announcements, hiring pages, reviews, and social accounts. Your business checks one screen instead of thirty browser tabs.
The tracking load justifies the setup. 85% of CI experts track press releases and media mentions, 77% monitor competitor websites for updates, and 74% follow competitors' social media accounts for insights. Nobody sustains that by hand across ten competitors while doing the rest of their job.
This guide covers what an intelligence dashboard should track, which data sources to connect, whether Power BI is enough or your company needs a purpose-built platform, and how the output feeds your marketing strategy.
What a competitive intelligence dashboard is
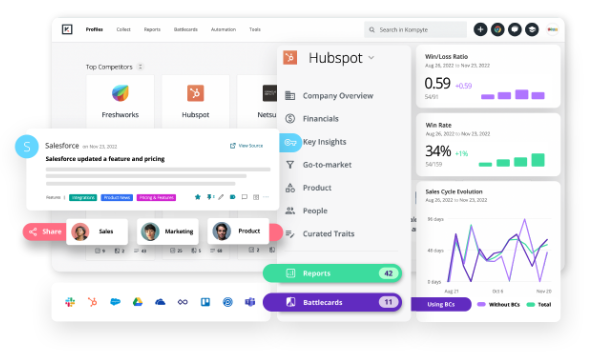
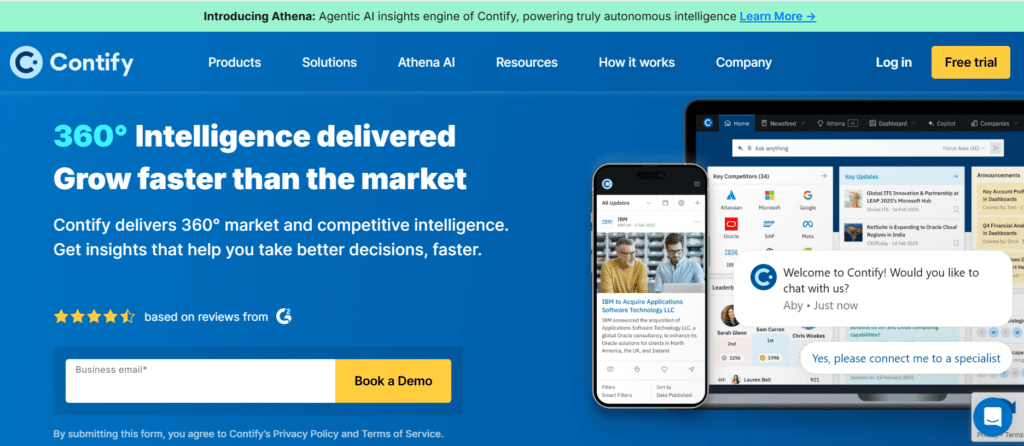
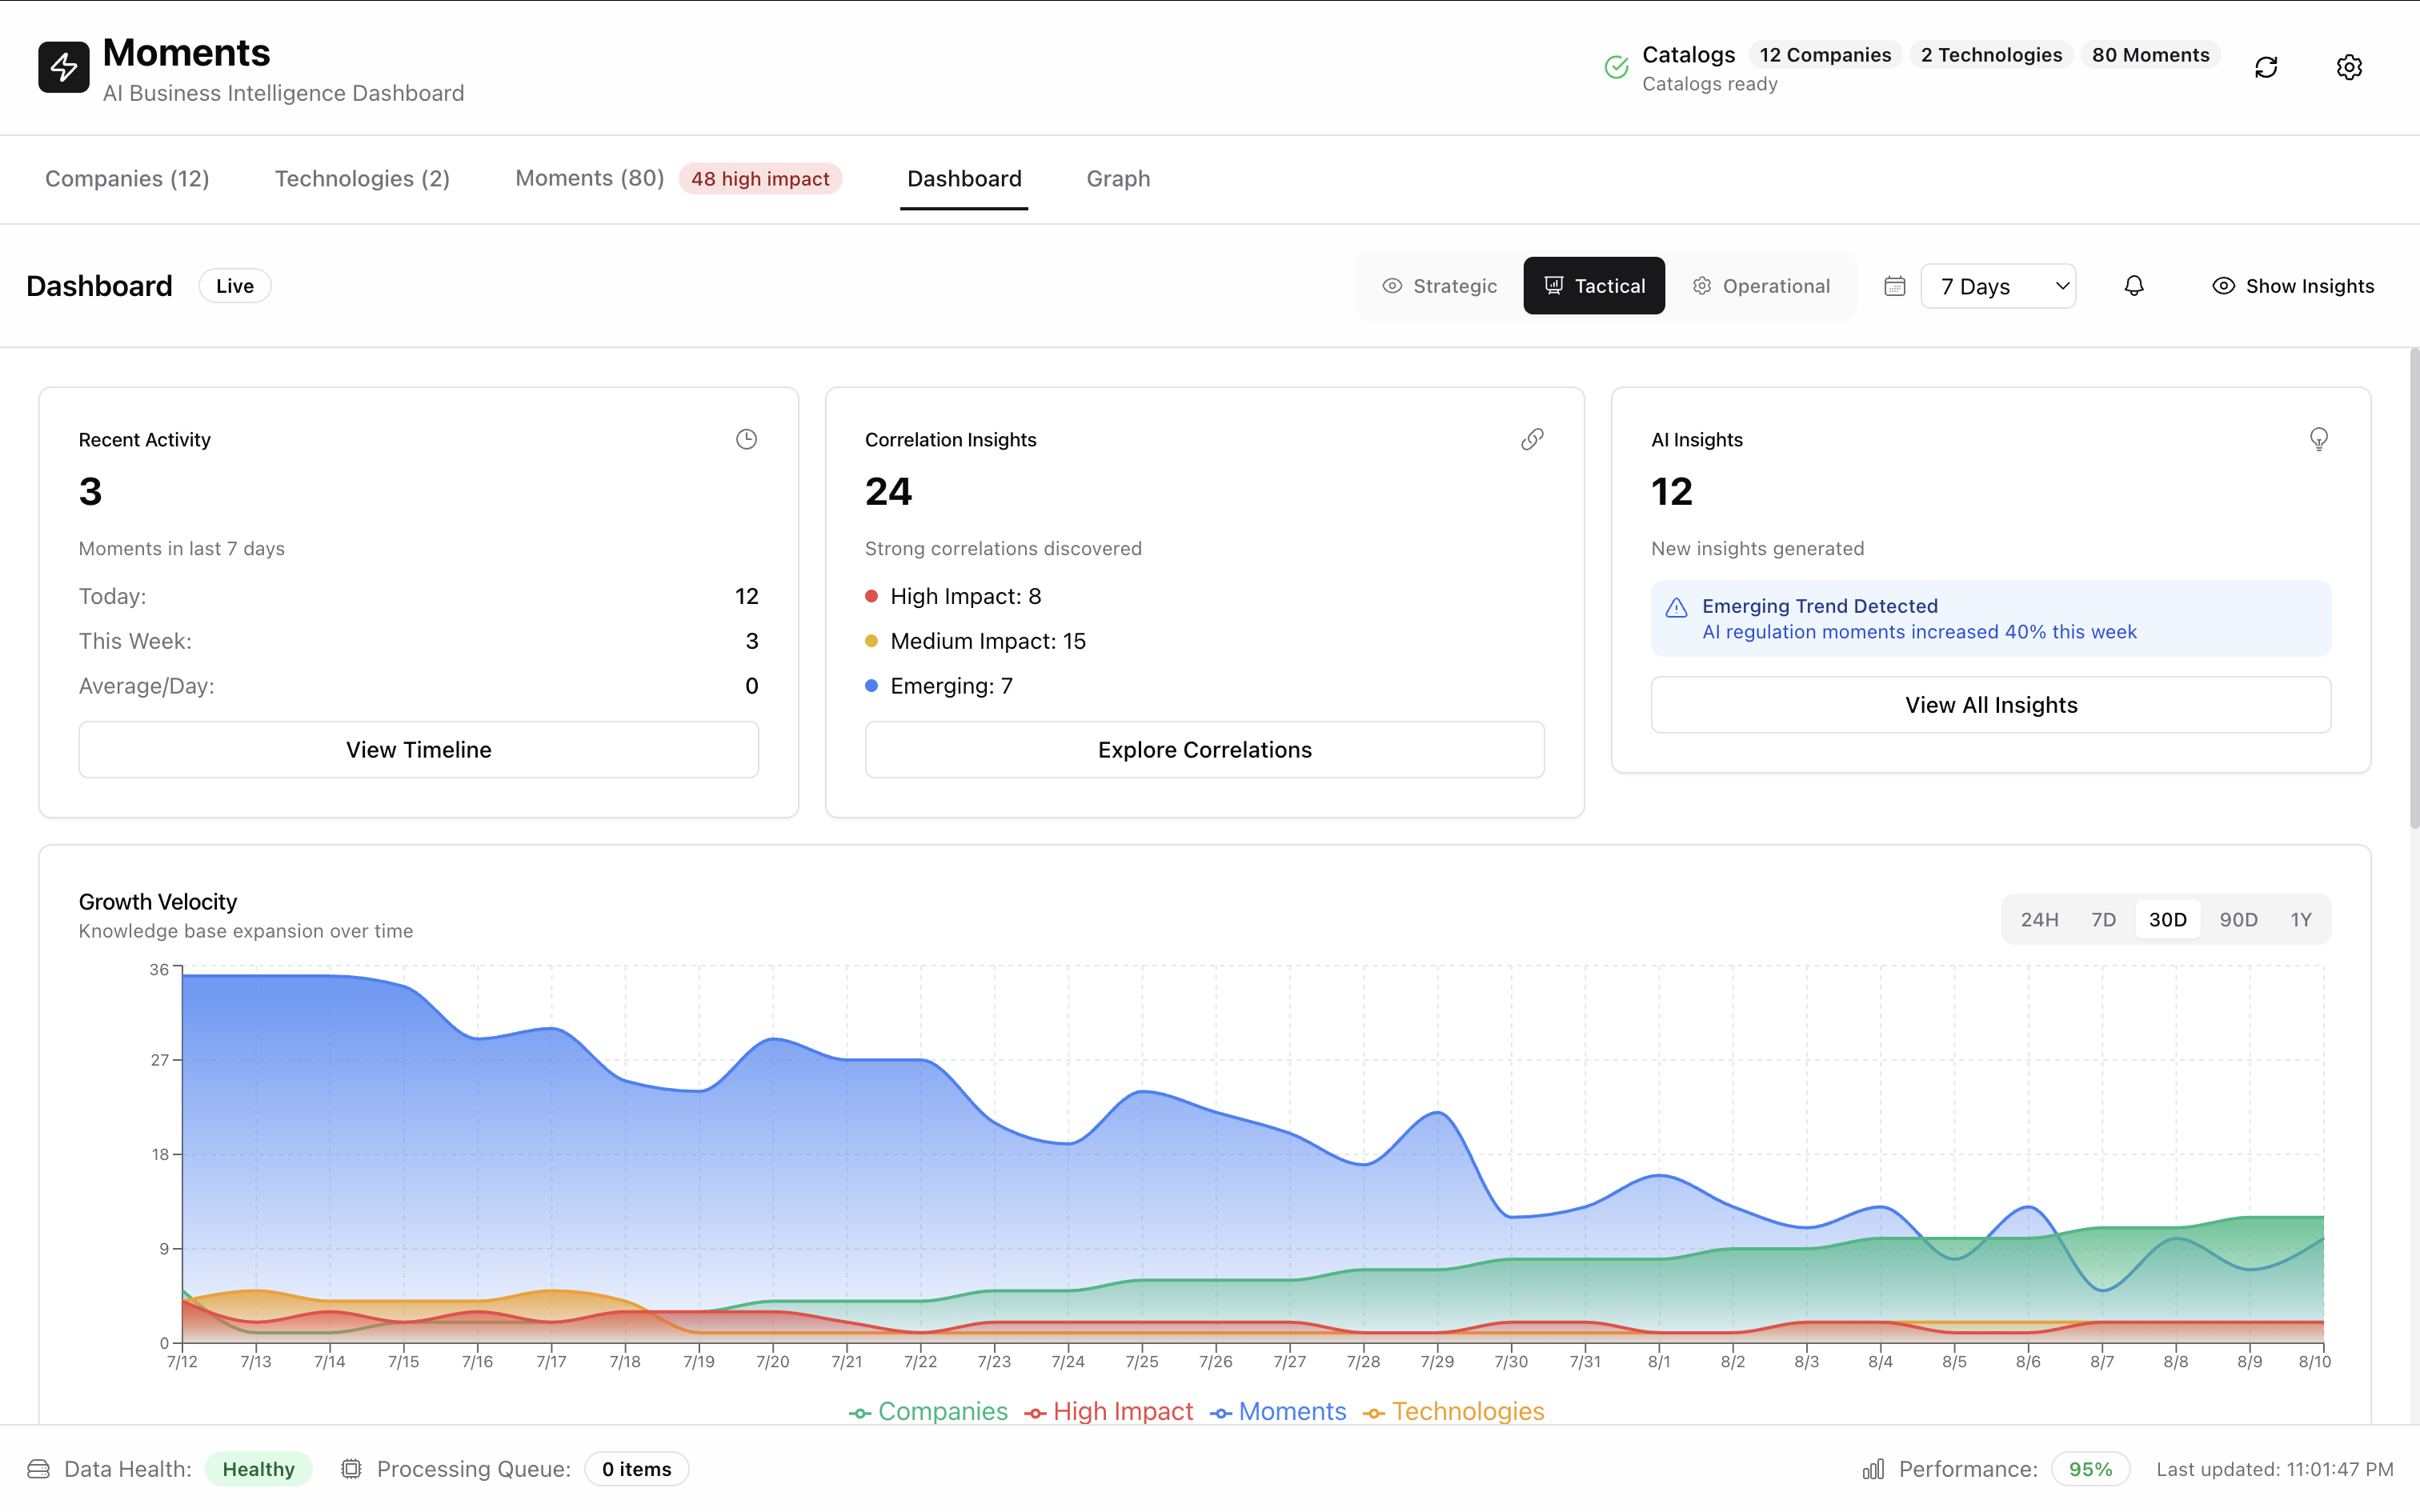
The term covers two different products. One is a BI dashboard (Power BI, Looker, Tableau) that visualizes data on competitors that your analysts collect and load themselves. The other is a platform designed specifically for competitive intelligence (Klue, Crayon, Kompyte, Contify) that handles collection, filtering, and delivery in one place.

Both aggregate data from multiple sources, and both support historical tracking. The difference is who does the gathering. With a BI tool, your analysts collect; with a CI platform, crawlers do the first pass. Kompyte's site claims its crawlers capture over 500 million data points from competitors' websites, social profiles, reviews, and hiring pages.
The dashboard sits at the delivery end of the intelligence cycle. Signals get collected from the market, filtered for relevance, synthesized into competitive insights, and surfaced where people already work. Every team gets access to the same evidence instead of its own folklore about competitors.
Dashboard or report: which one your business needs
A competitive intelligence report consolidates insights about competitors into a document: a quarterly deep-dive, a competitor profile, a benchmarking table. The dashboard is the always-on layer underneath those reports. A mature competitive intelligence program runs both and lets each format do what it's good at. Reports interpret; dashboards record.
What reports do that dashboards can't
Reports carry argument. A competitor profiles report covers five to ten key competitors and reads as analysis: what changed, why it matters, what the company should do about it. Useful CI reports highlight changes since the last reporting cycle instead of restating what the reader already knows.
Reports also travel upward better. A VP reads a two-page brief on the train; she won't click through dashboard filters. Strategic decisions get made in rooms where documents circulate, so reports stay the format that reaches them.
What dashboards do that reports can't
A dashboard answers questions between reporting cycles. When competitors cut prices on a Tuesday, the next report is six weeks away, but the dashboard flags the change the following morning. Real-time insights give teams the chance to differentiate or counter while the move is still fresh.
Dashboards also make the reports better. Analysts who track competitors through a dashboard write reports from logged, timestamped evidence rather than memory, and the data analysis is already done before the writing starts.
What CI teams track most
Four categories dominate what practitioners track and keep on screen. Each earns its place in the dashboard for a different reason.
Press releases and media mentions
85% of CI experts track press releases and media mentions. Announcements are competitors describing their strategy in public: funding rounds, partnerships, product launches, executive hires.
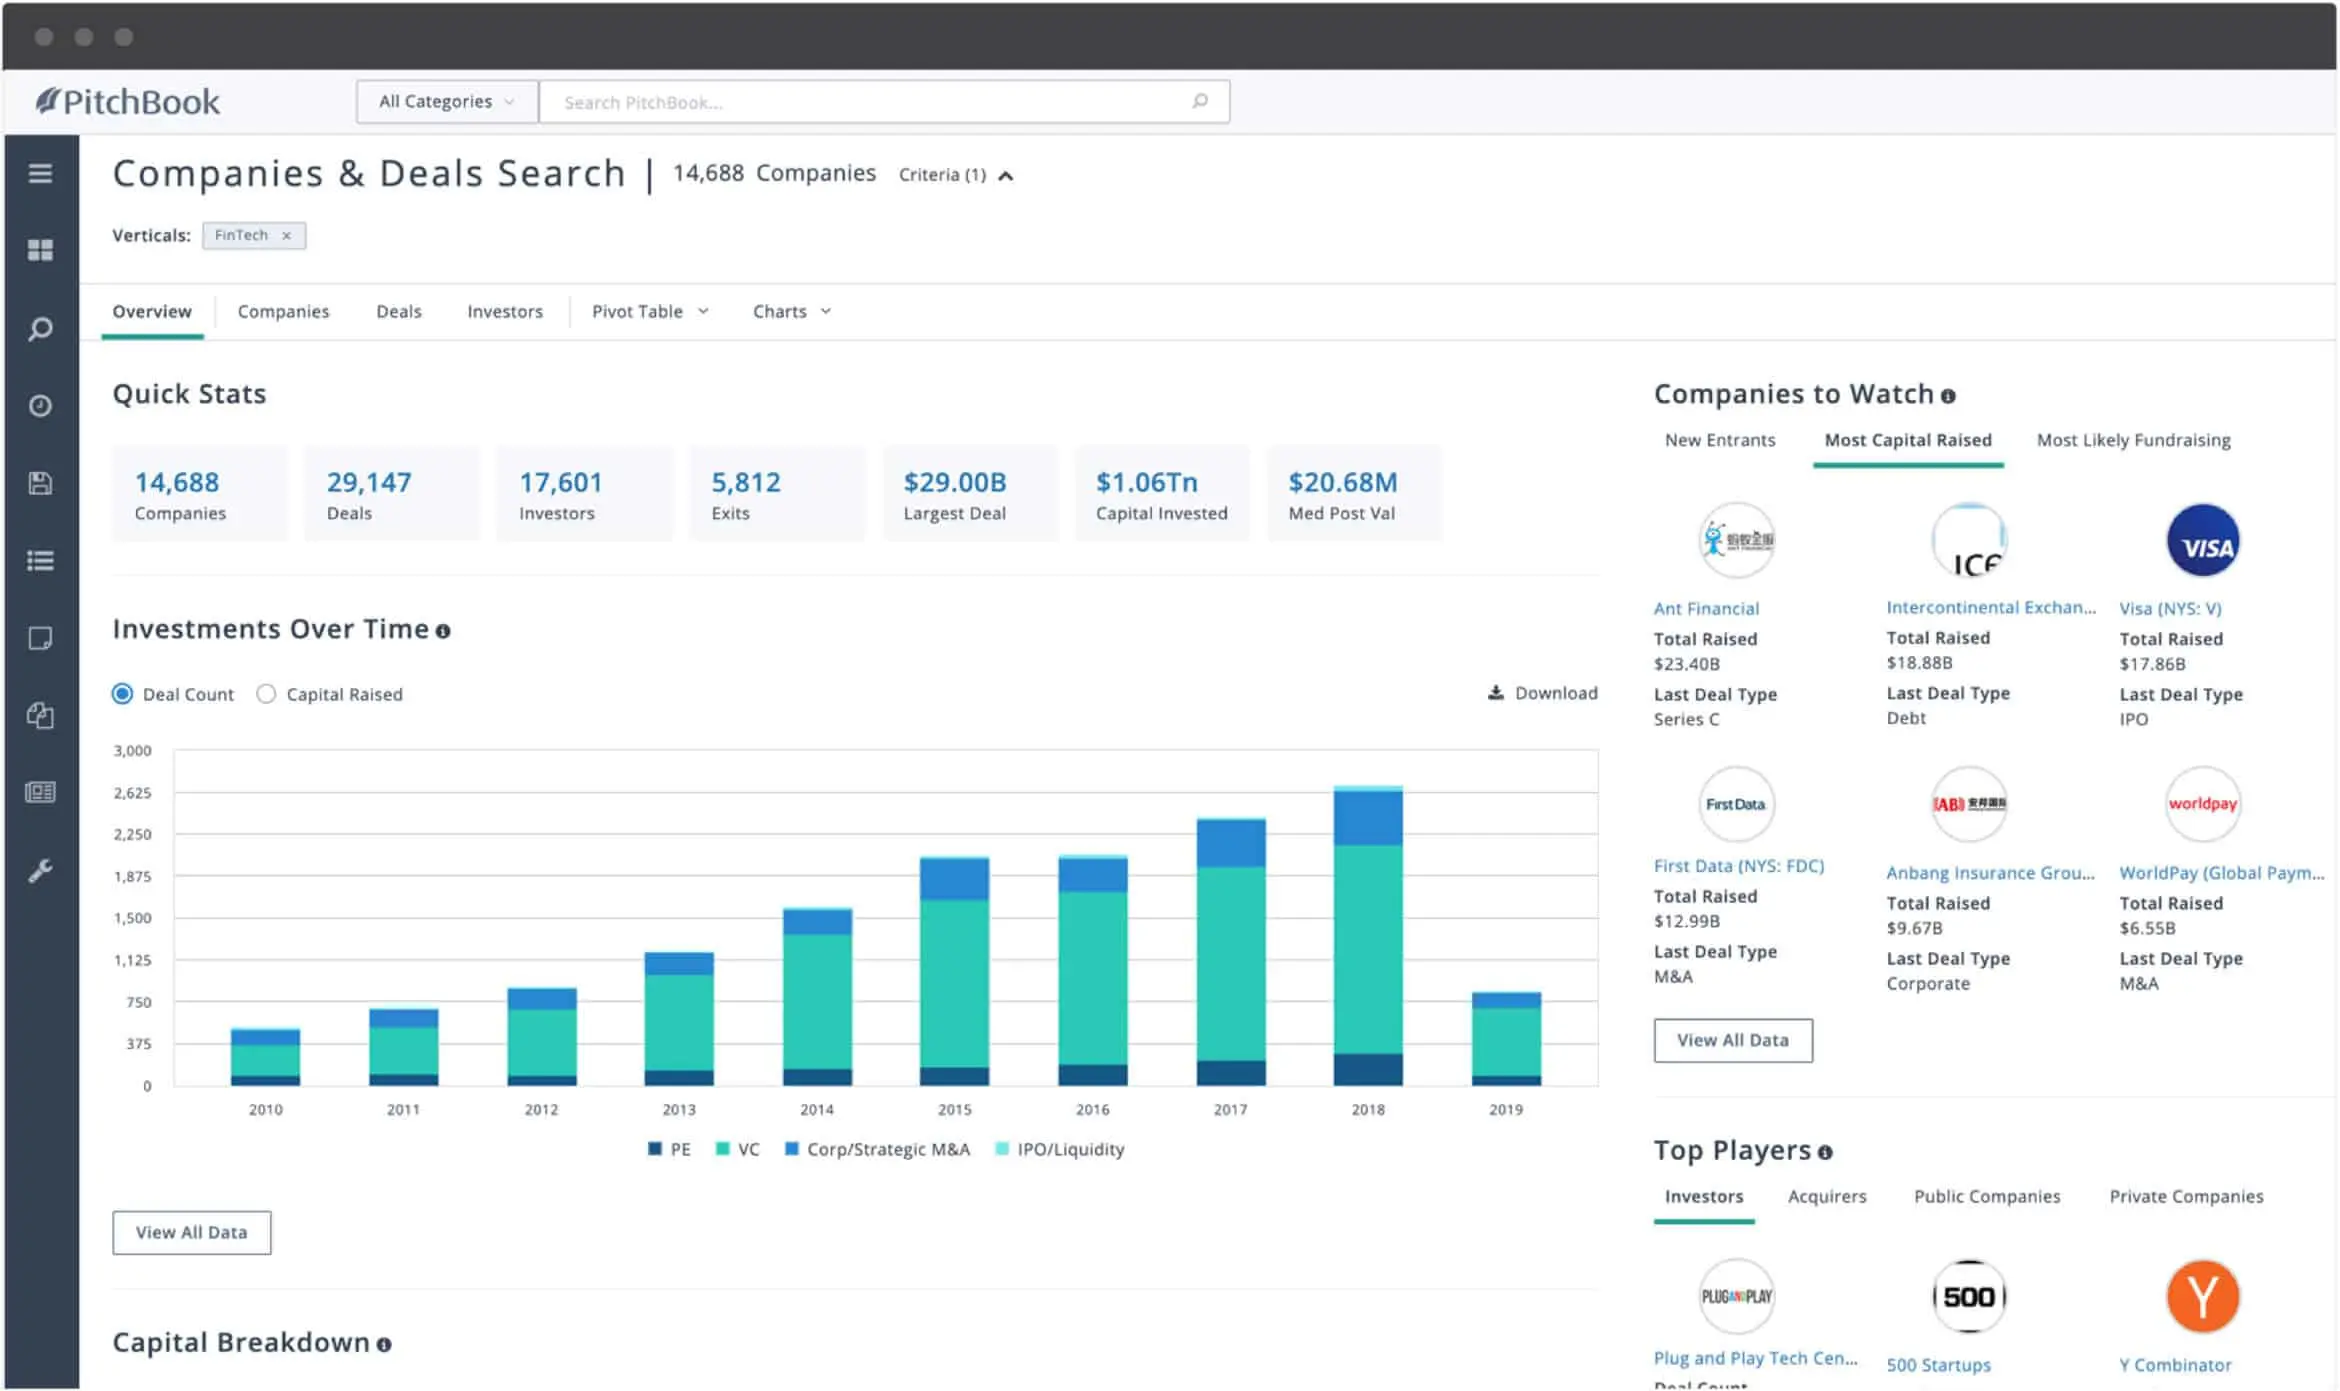
The volume is manageable per company and brutal in aggregate. Ten competitors publishing twice a month is 240 items a year, and a dashboard files each one against the right company without anyone reading feeds at 8 a.m.
Competitor websites
77% monitor competitor websites for updates. Pricing pages, feature lists, and homepage messaging change there first, often with no announcement at all.
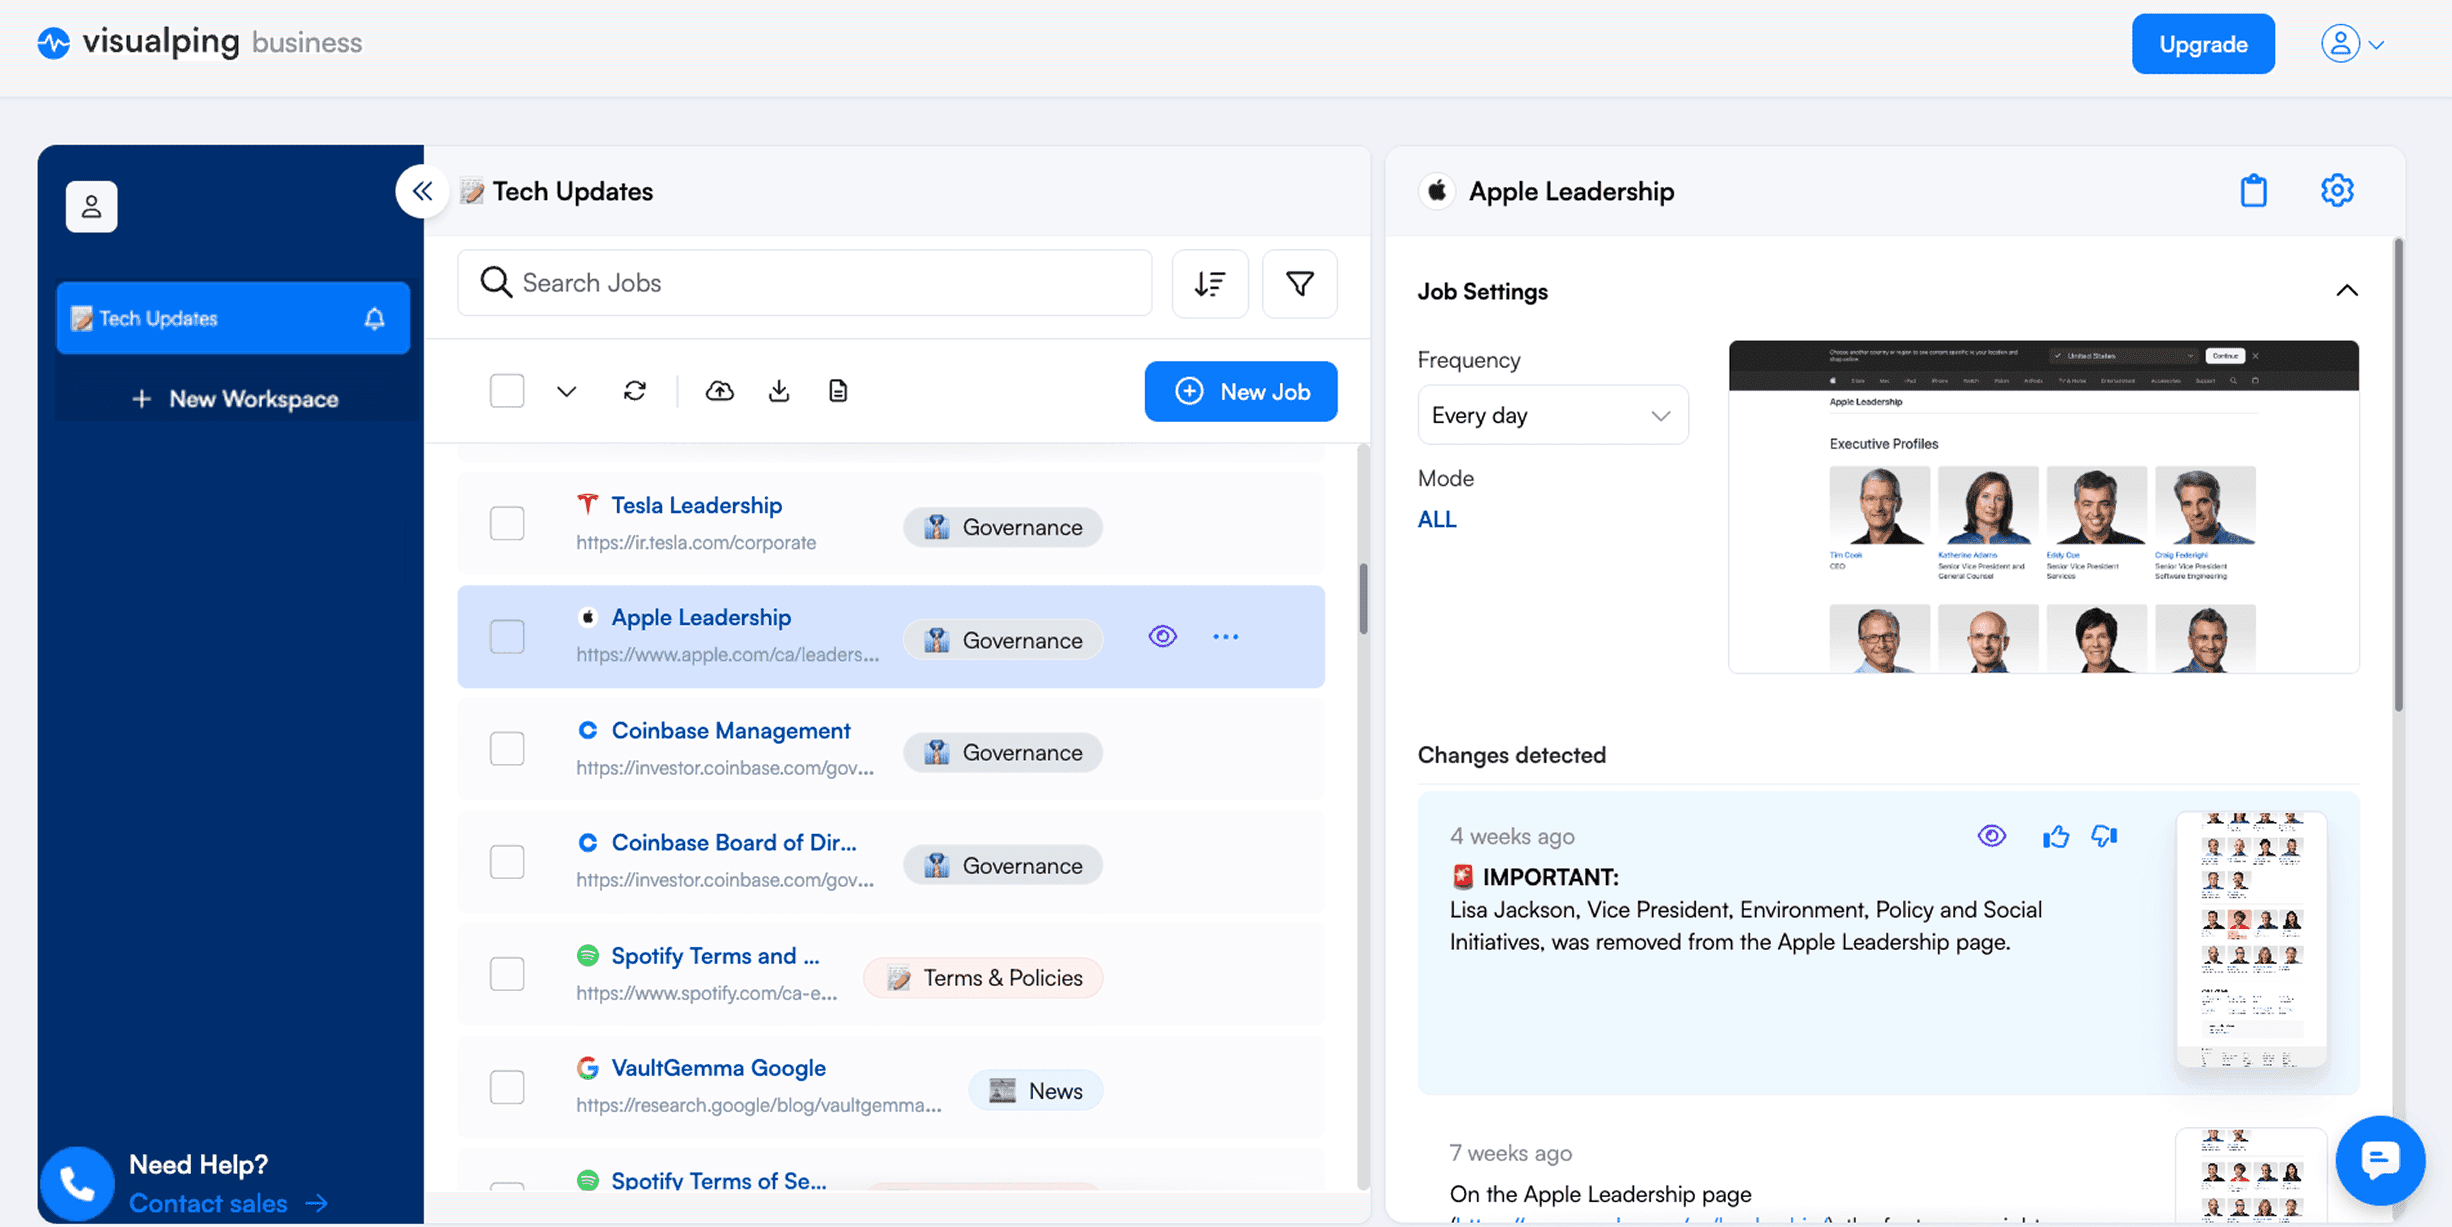
Manual checking misses quiet edits; no company staffs it reliably. Automated competitor monitoring compares yesterday's version of a page against today's and logs the difference, including changes buried in drop-down menus that a screenshot review would never catch.
Social media accounts
74% follow competitors' social accounts for insights. Social shows positioning experiments, campaign themes, and event activity earlier than most channels.
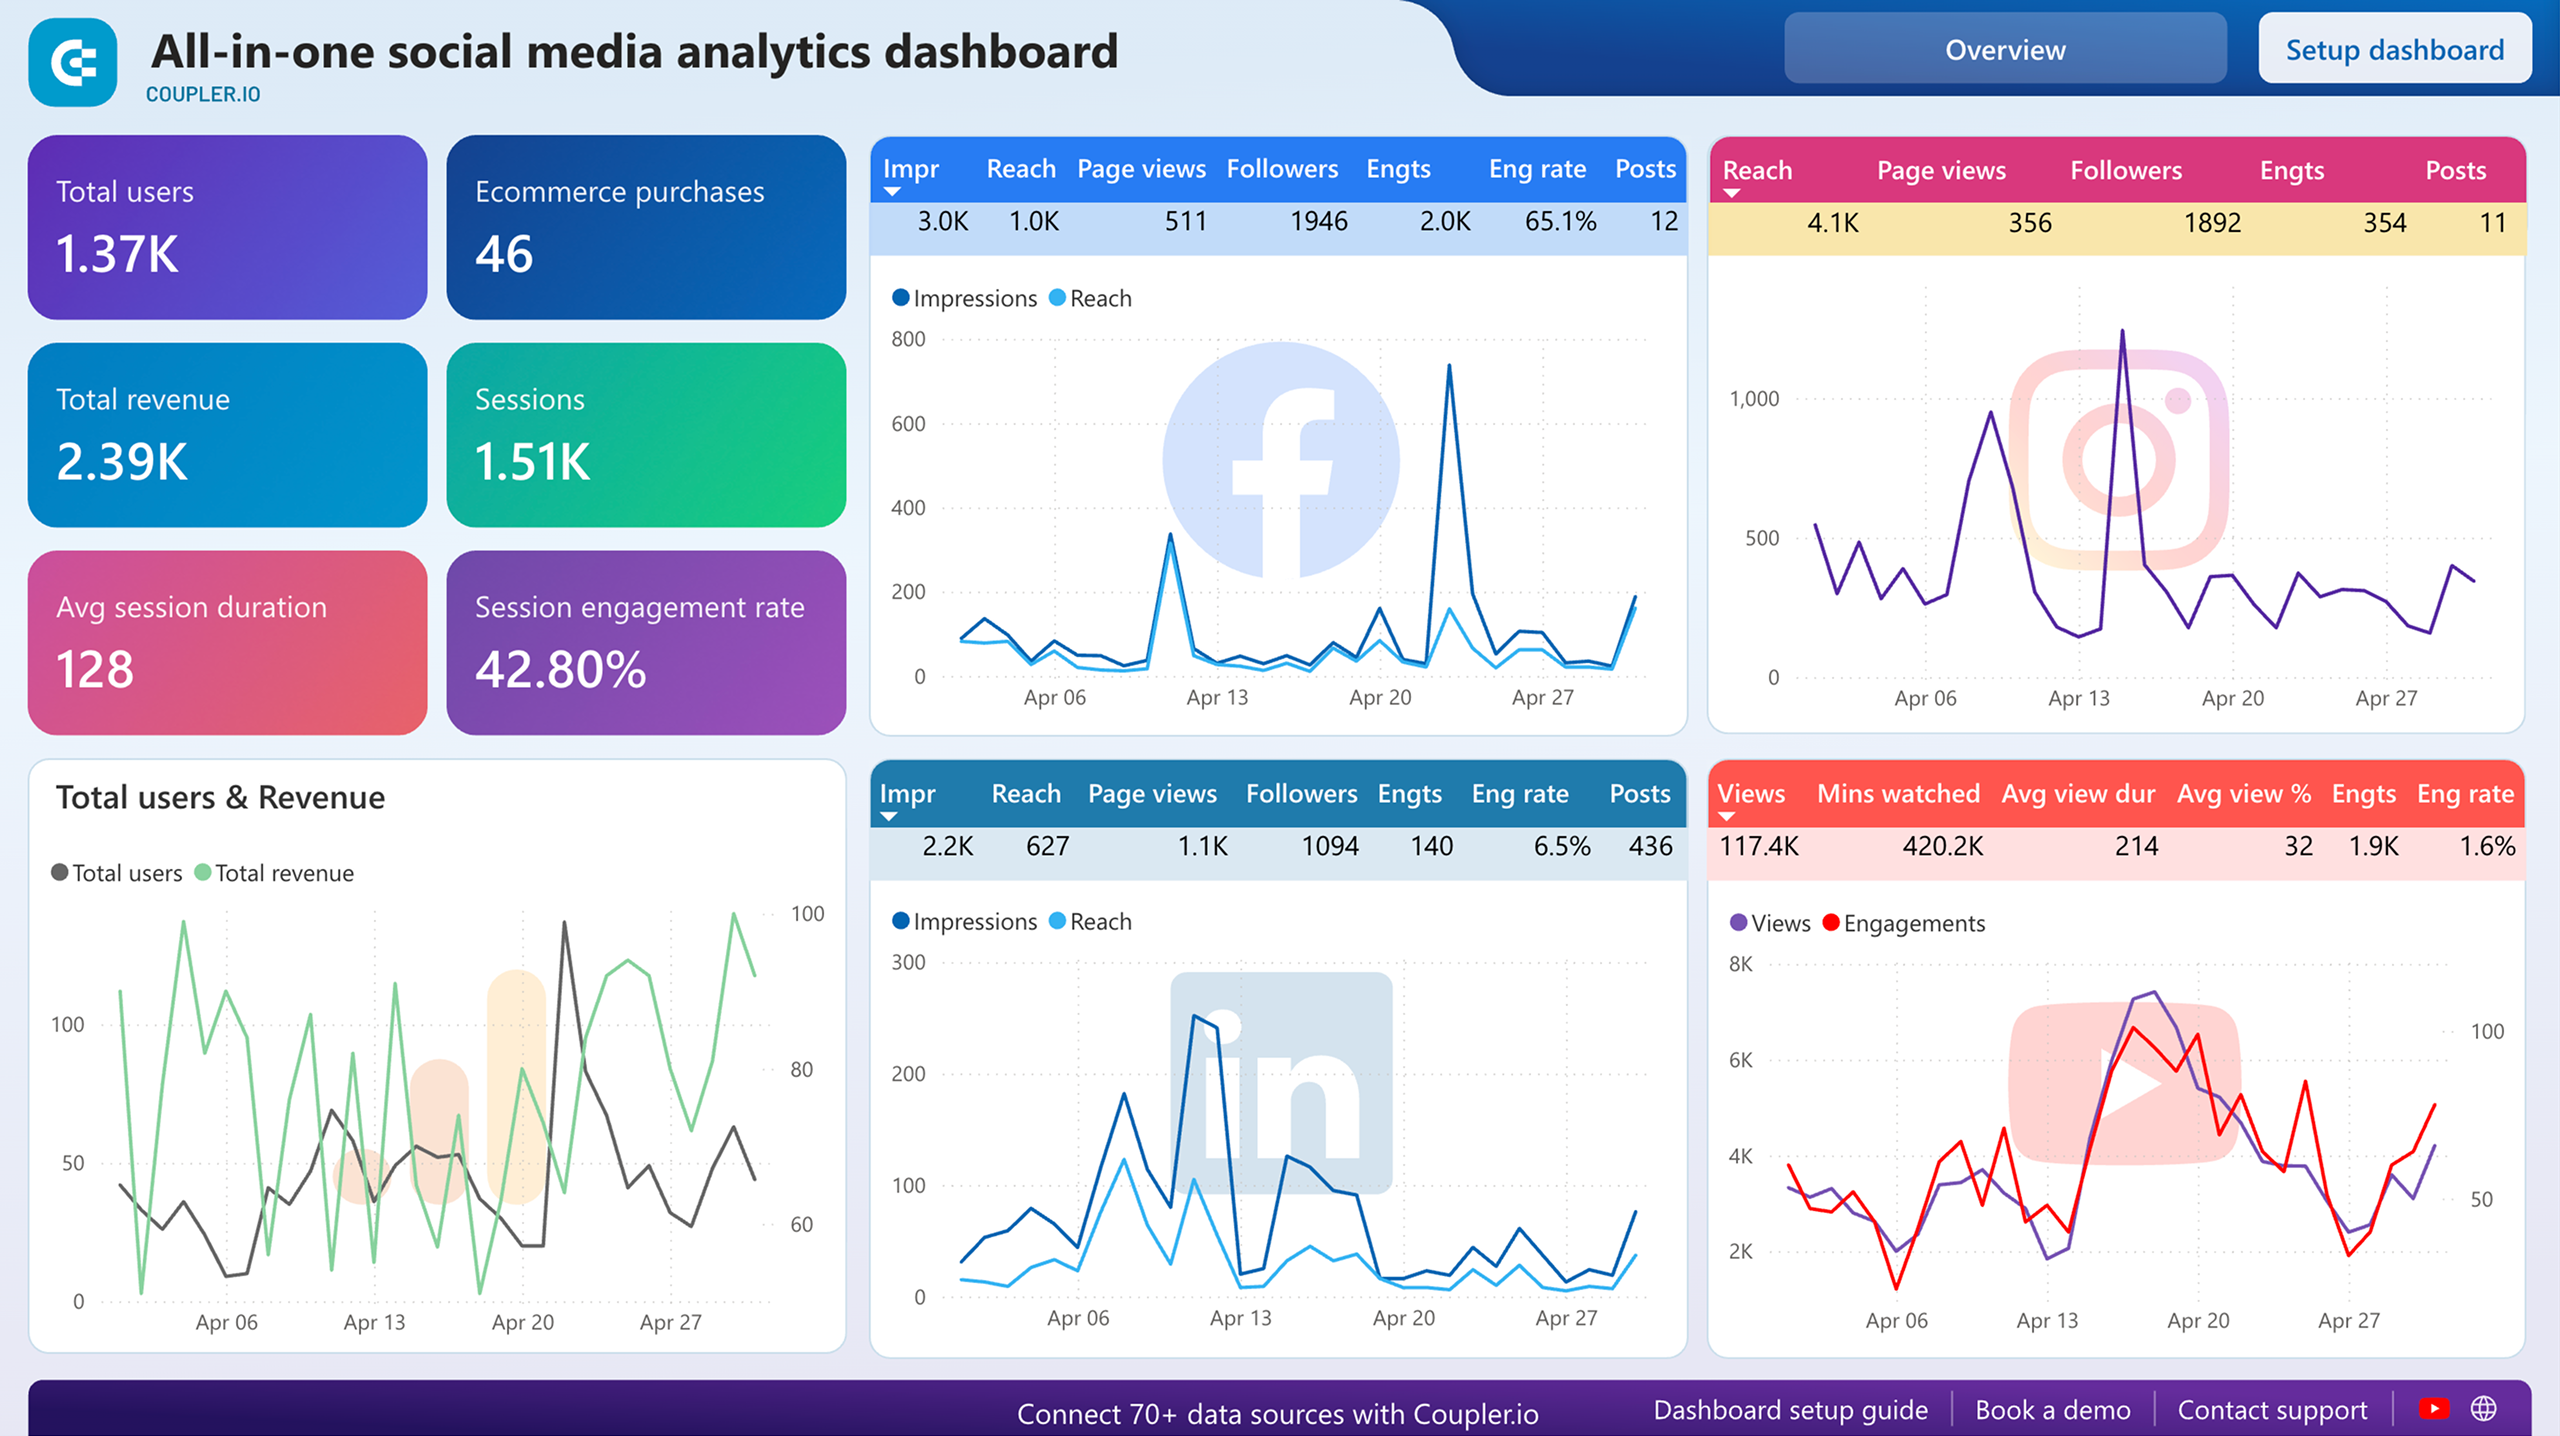
Tone shifts show up there first too. Competitors that start posting about a new industry segment are usually telling you where their marketing strategy is headed next.
Competitor pricing
85% of CI experts track competitor pricing changes regularly, for a plain reason: competitor pricing changes directly impact your revenue. A price drop you catch in week one becomes a counter-offer; one you catch in month three becomes a paragraph in a lost-deals report.
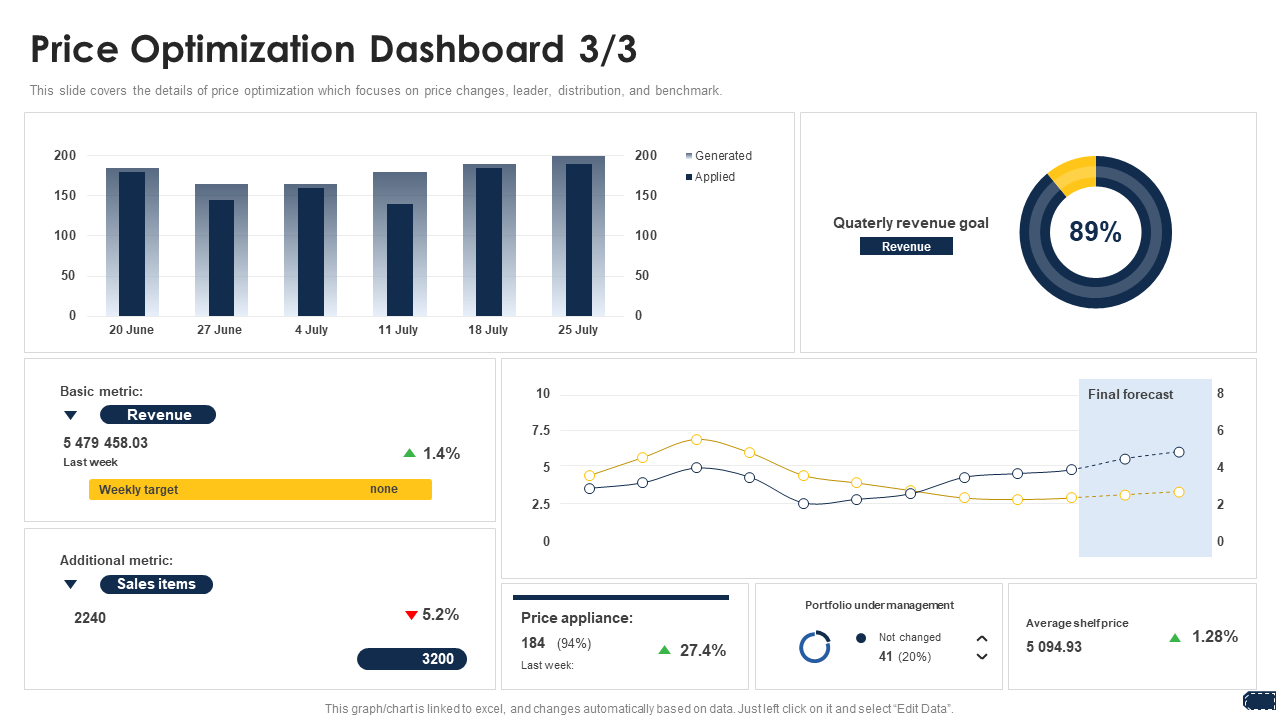
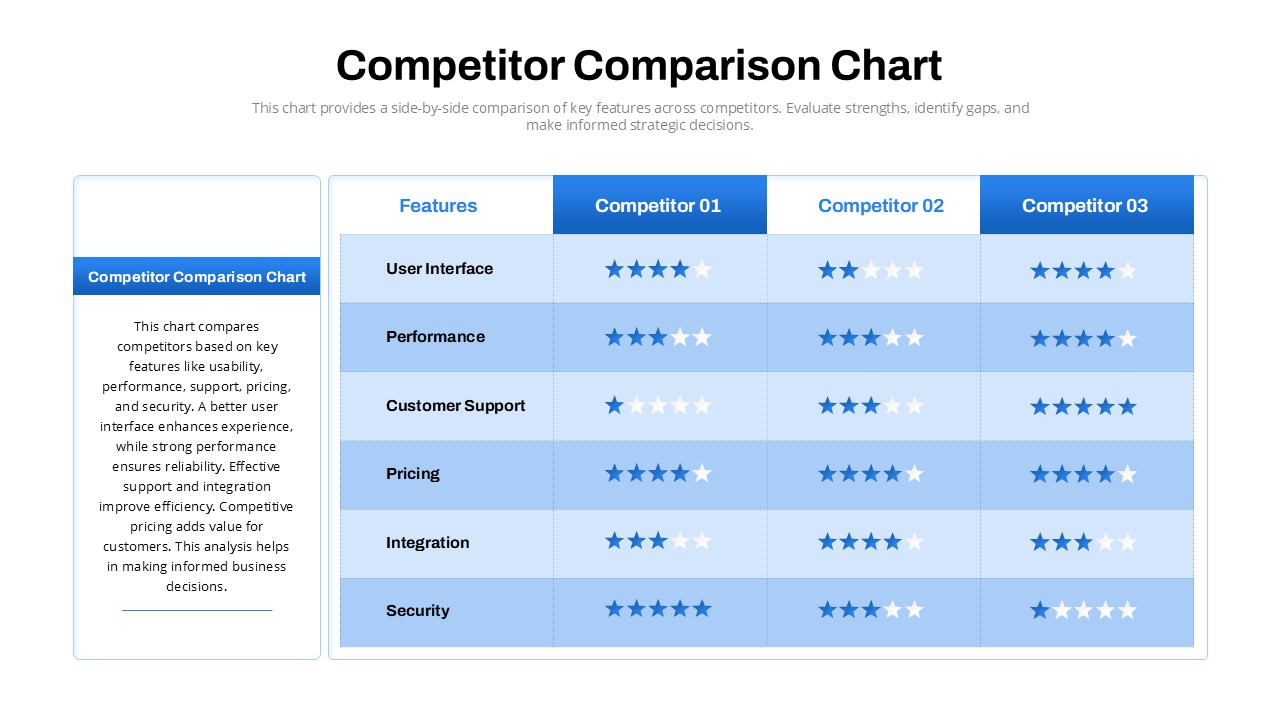
Tracking competitor pricing models over time also helps identify market patterns. Benchmarking views that compare pricing tiers side-by-side show whether a change is a promotion, a repackaging, or a new pricing strategy.
Emerging threats and market trends
The four categories above cover known competitors; emerging threats come from outside that list. Emerging competitors show up first in customer behavior (churn interviews, community threads, reviews) rather than in the trade press your dashboard already reads.

Market trends deserve a lane of their own. A dashboard that tracks market trends alongside specific competitors catches shifts in market dynamics, such as an industry segment consolidating, before they show up as missed opportunities in the pipeline. Those early insights are cheap; the late ones cost market share.
Data sources worth connecting
Strong dashboards mix external signals with internal ones, and intelligence quality tracks source quality. External sources tell you what competitors say; internal sources tell you what customers and sales teams experience when they meet those competitors in the market.
Reviews and customer sentiment
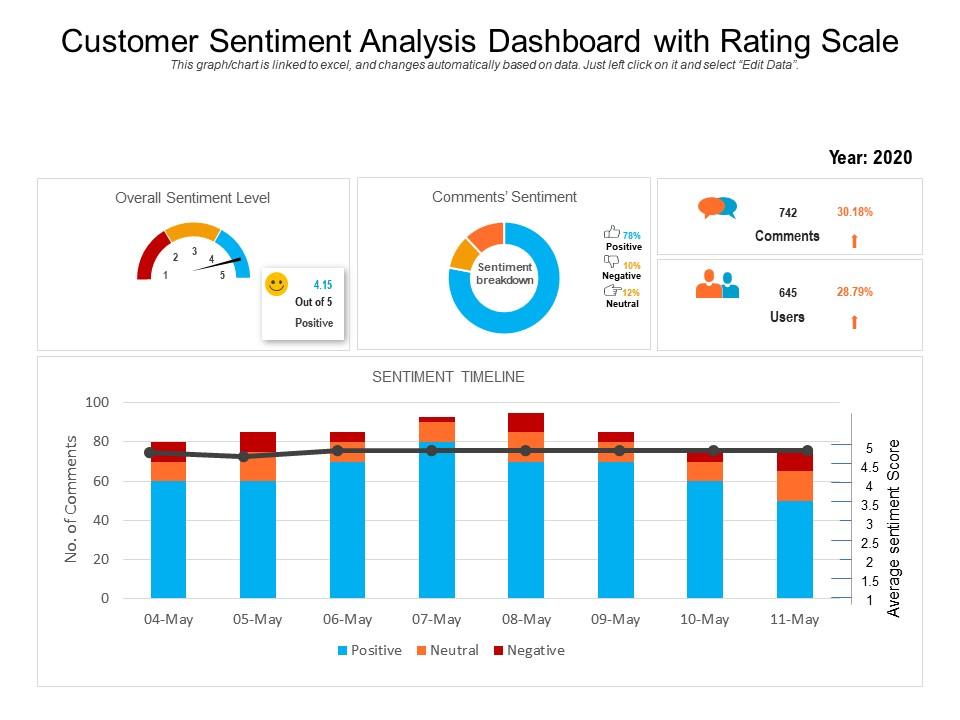
Customer sentiment analysis is the most direct route to competitors' weaknesses. Review sites like G2, Capterra, and TrustRadius list a competitor's product gaps and common complaints in the customers' own words, at no research cost to your business.
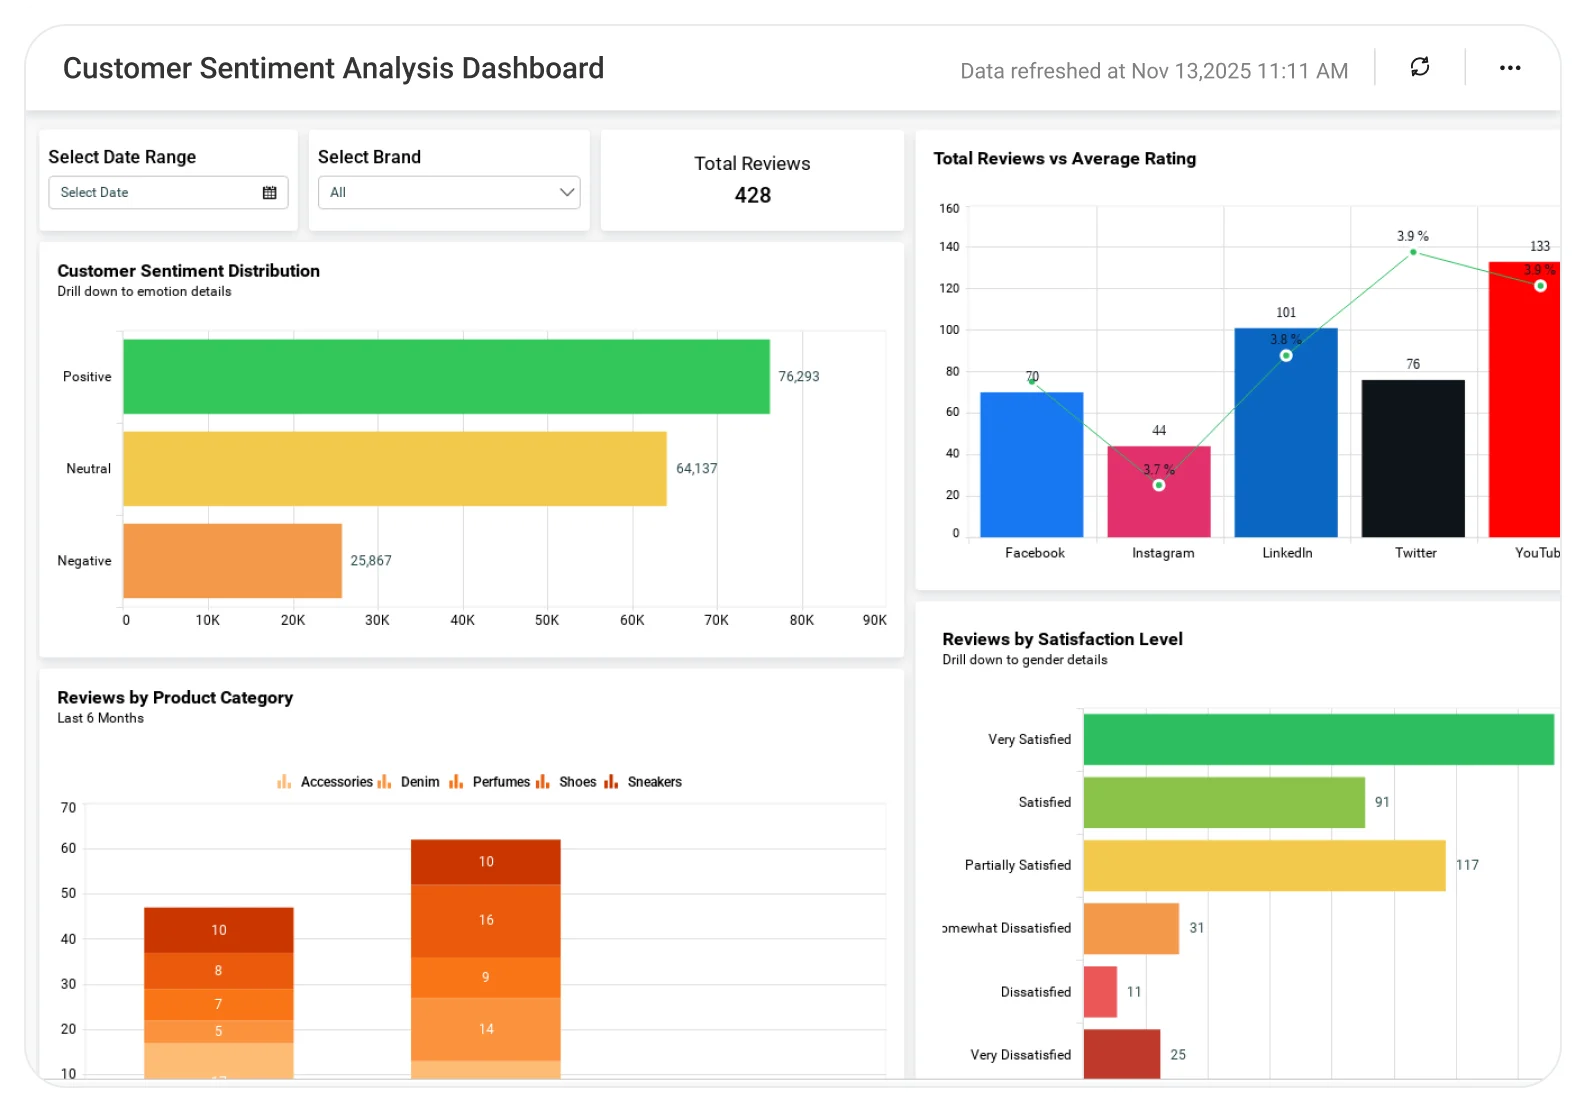
Feed those specific insights straight into battlecards. When a rival's users keep reporting slow support, your sales team should hear about it before the next deal, not after losing it.
Job postings
Hiring pages leak roadmaps. Job postings for machine-learning engineers at a company that has never shipped an AI feature tell you what's coming before any announcement does.
The same listings reveal expansion plans. A first sales hire in Germany signals market penetration plans for Europe; a batch of support roles means the customer base grew faster than the team.
SEO rankings, paid ads, and social engagement
Channel data shows where competitors spend. Dashboards that monitor SEO rankings, paid advertising, and social media engagement reveal which marketing channel competitors are betting on and which one they've quietly abandoned.
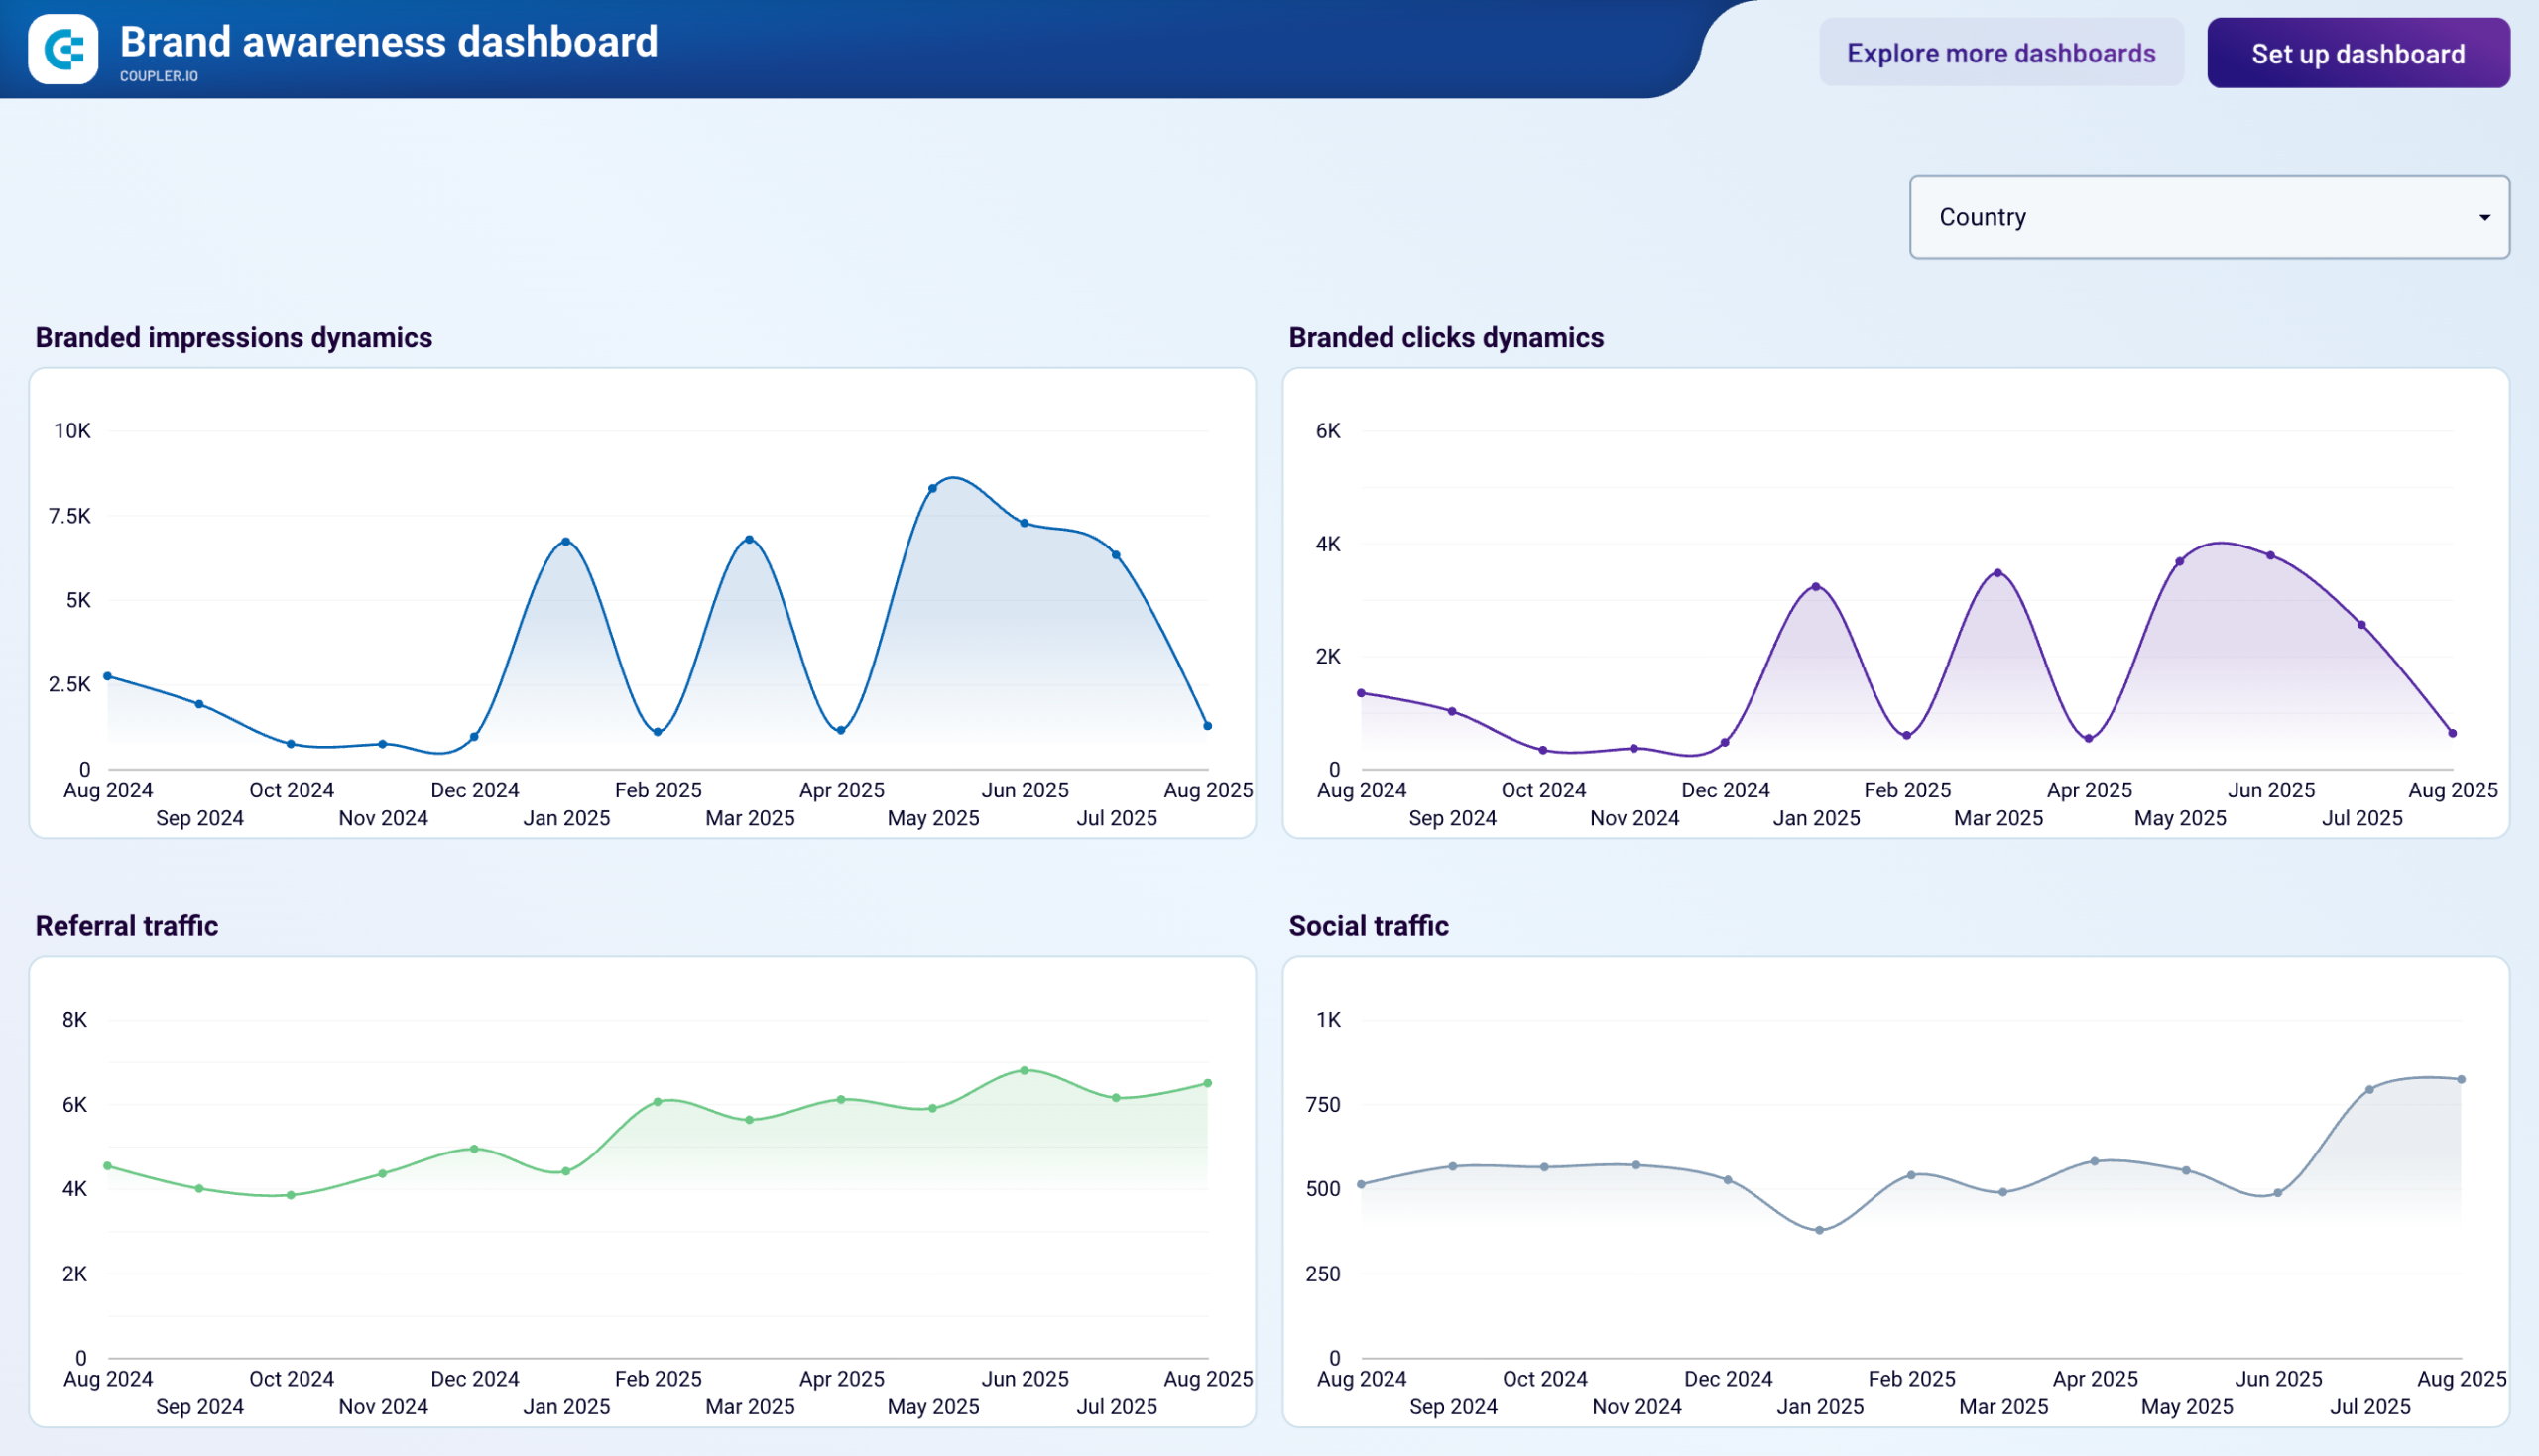
The same data grades their execution. If competitors outrank you on the keywords your marketing campaigns target, that's a measurable gap with a measurable fix, not a vague worry.
CRM data and win/loss records
CRM data turns outside-in intelligence into ground truth. Win/loss records tied to specific competitors show who beats your company, in which segment, and on what objection, straight from your own pipeline. Track them by competitor and by quarter.
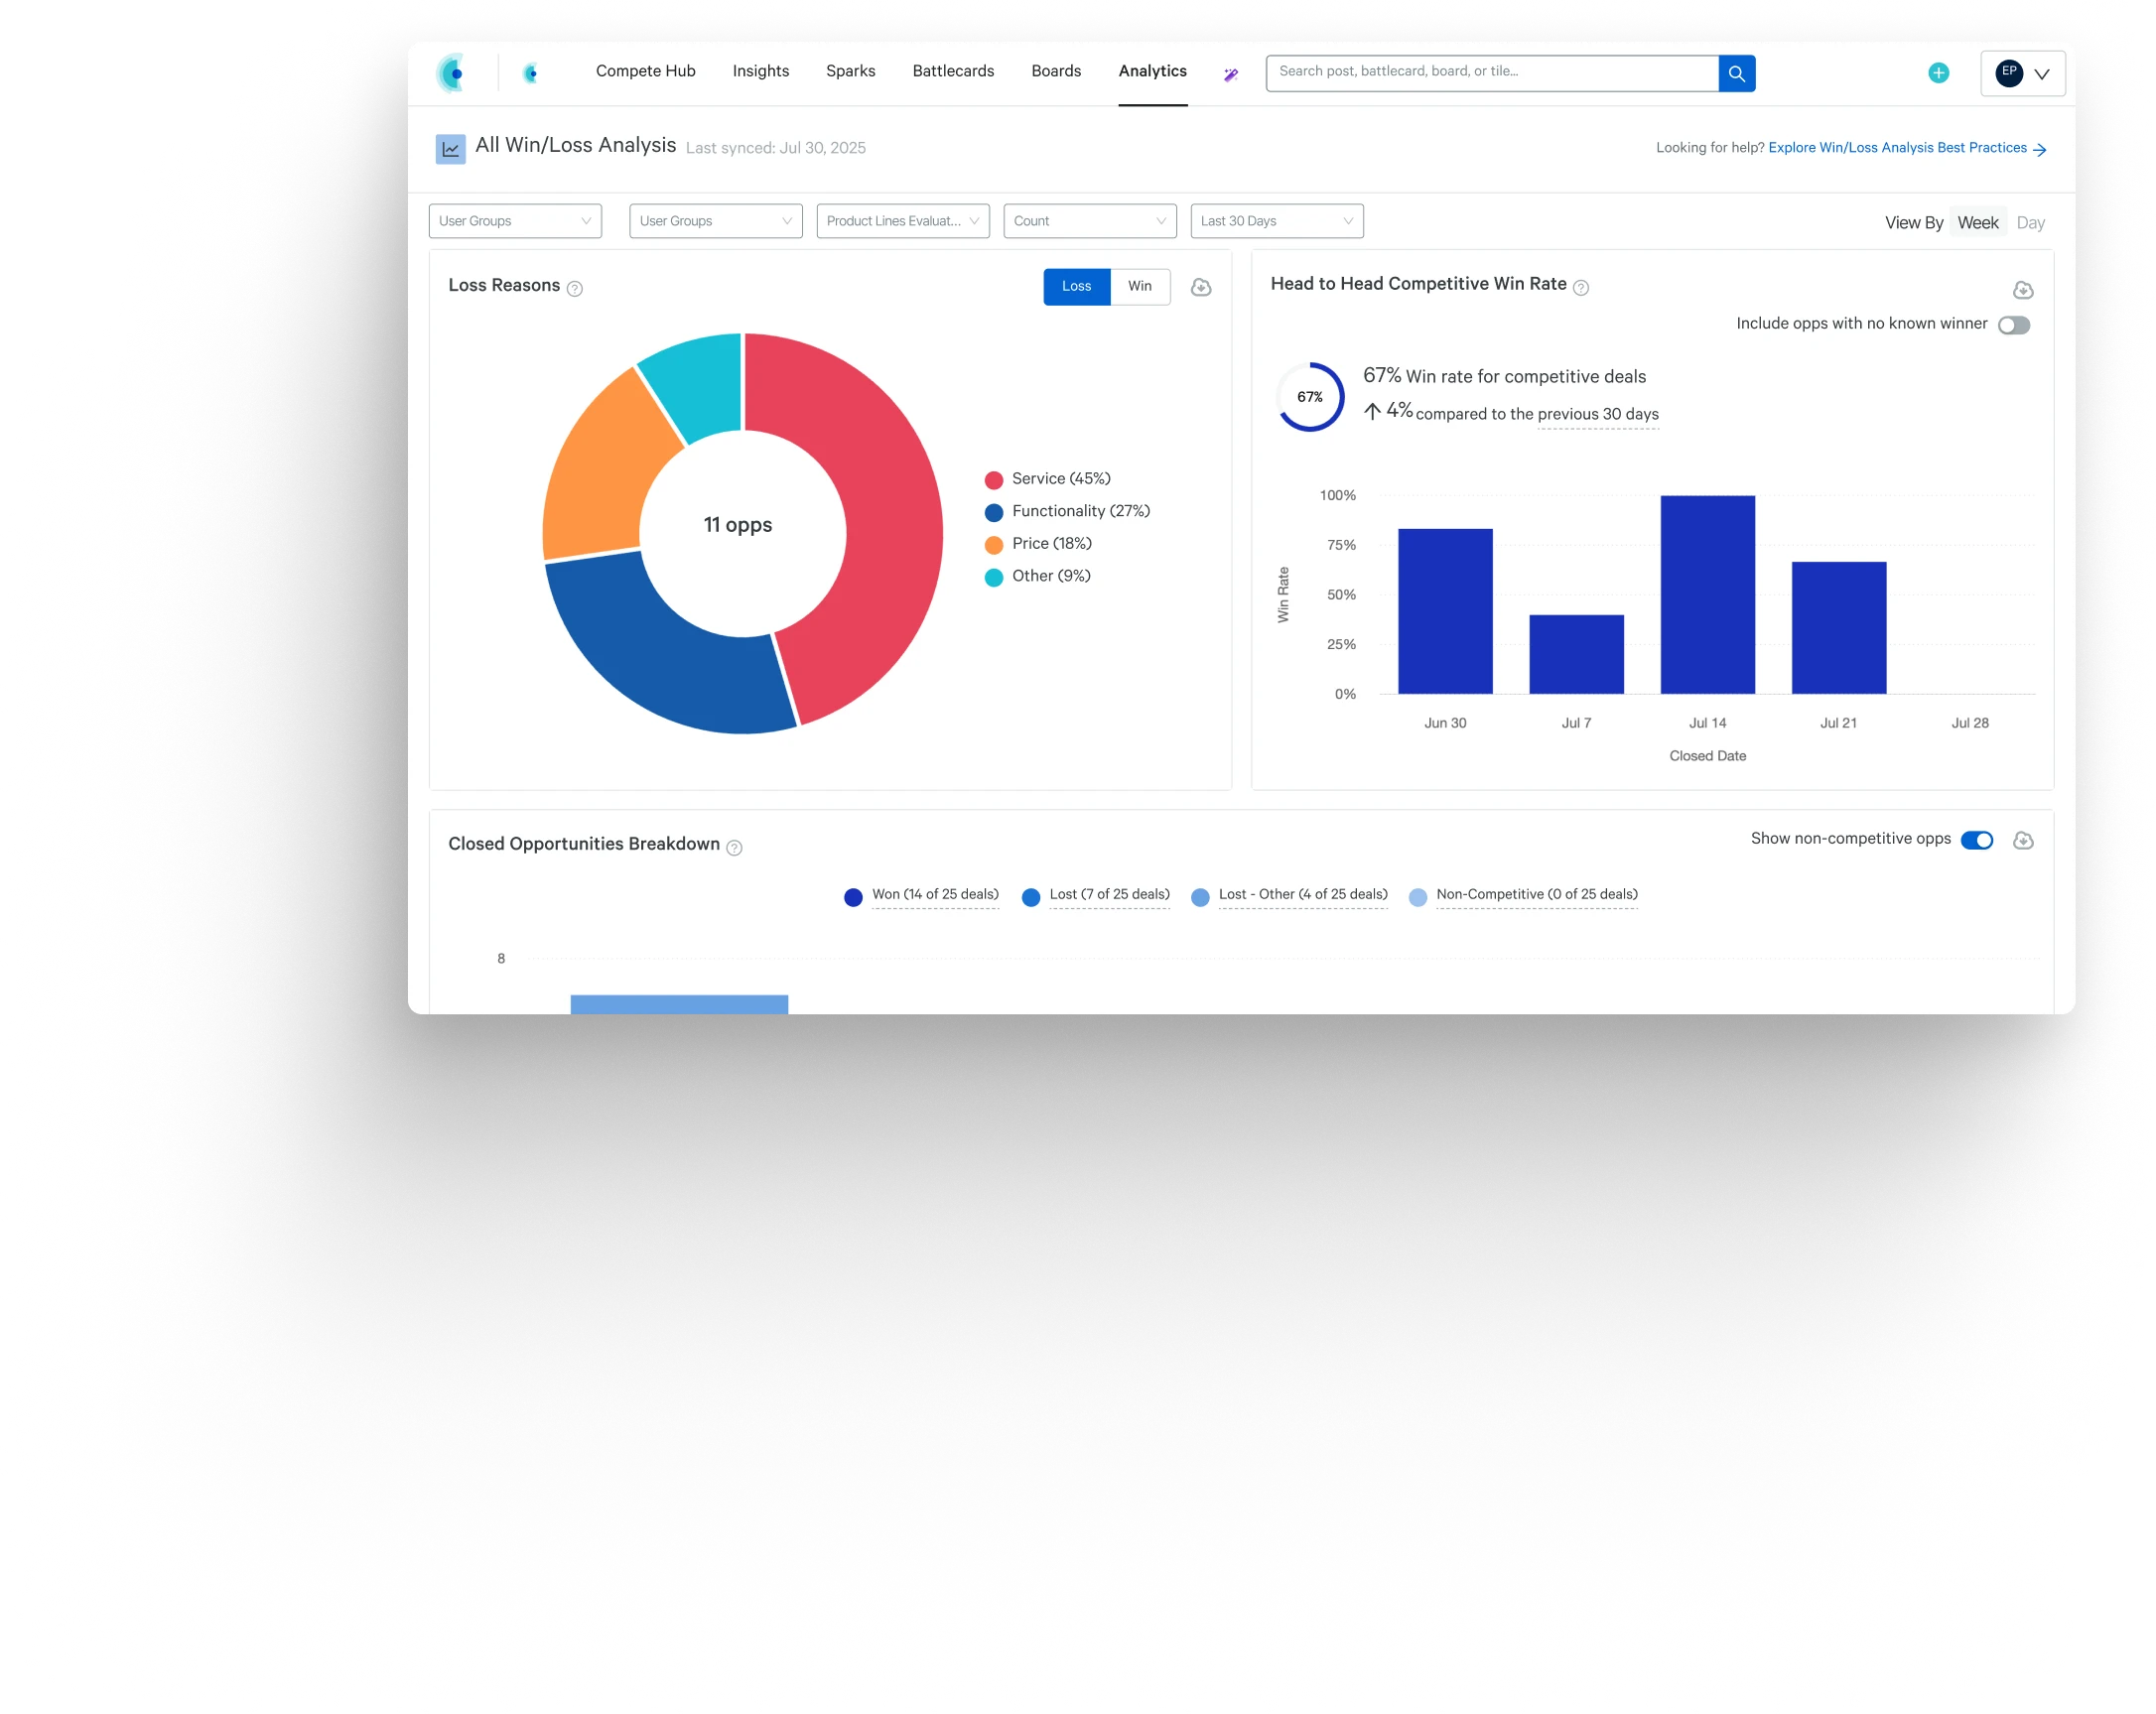
Vendors treat this as core dashboard material. Kompyte pulls win/loss records through a two-way Salesforce integration, Klue acquired the win-loss firm DoubleCheck, and Crayon partnered with Primary Intelligence for the same capability.
Benefits of a competitive intelligence dashboard
Automated data collection
The first benefit is hours. Dashboards save time by automating the data collection that analysts otherwise do by hand, and gathering data manually across dozens of sites is exactly the work people quietly stop doing when a quarter gets busy.
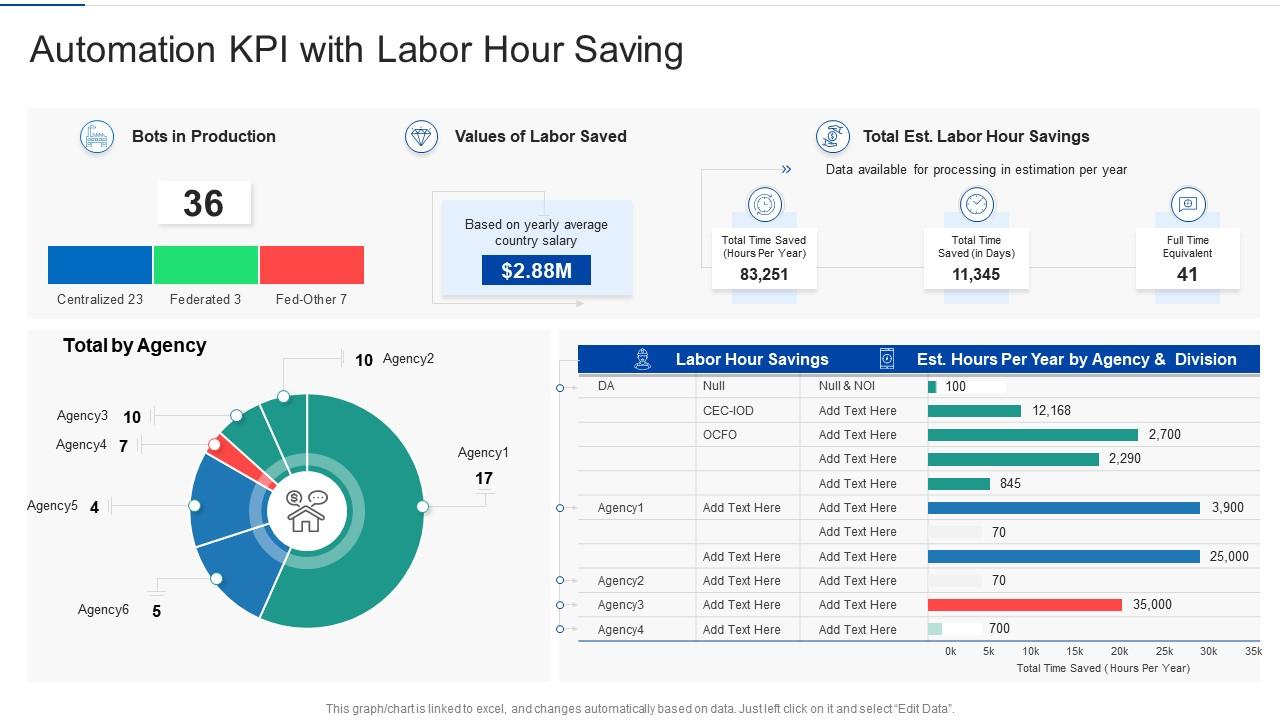
Automation also closes gaps. A person skips a week; a crawler doesn't. Dashboards help your business avoid gaps in intelligence tracking, and gaps are where missed opportunities live.
Historical tracking
A dashboard with historical tracking answers "since when?", which is the question every executive asks second. The record shows whether competitors' discounts are one-offs or the fourth round this year.
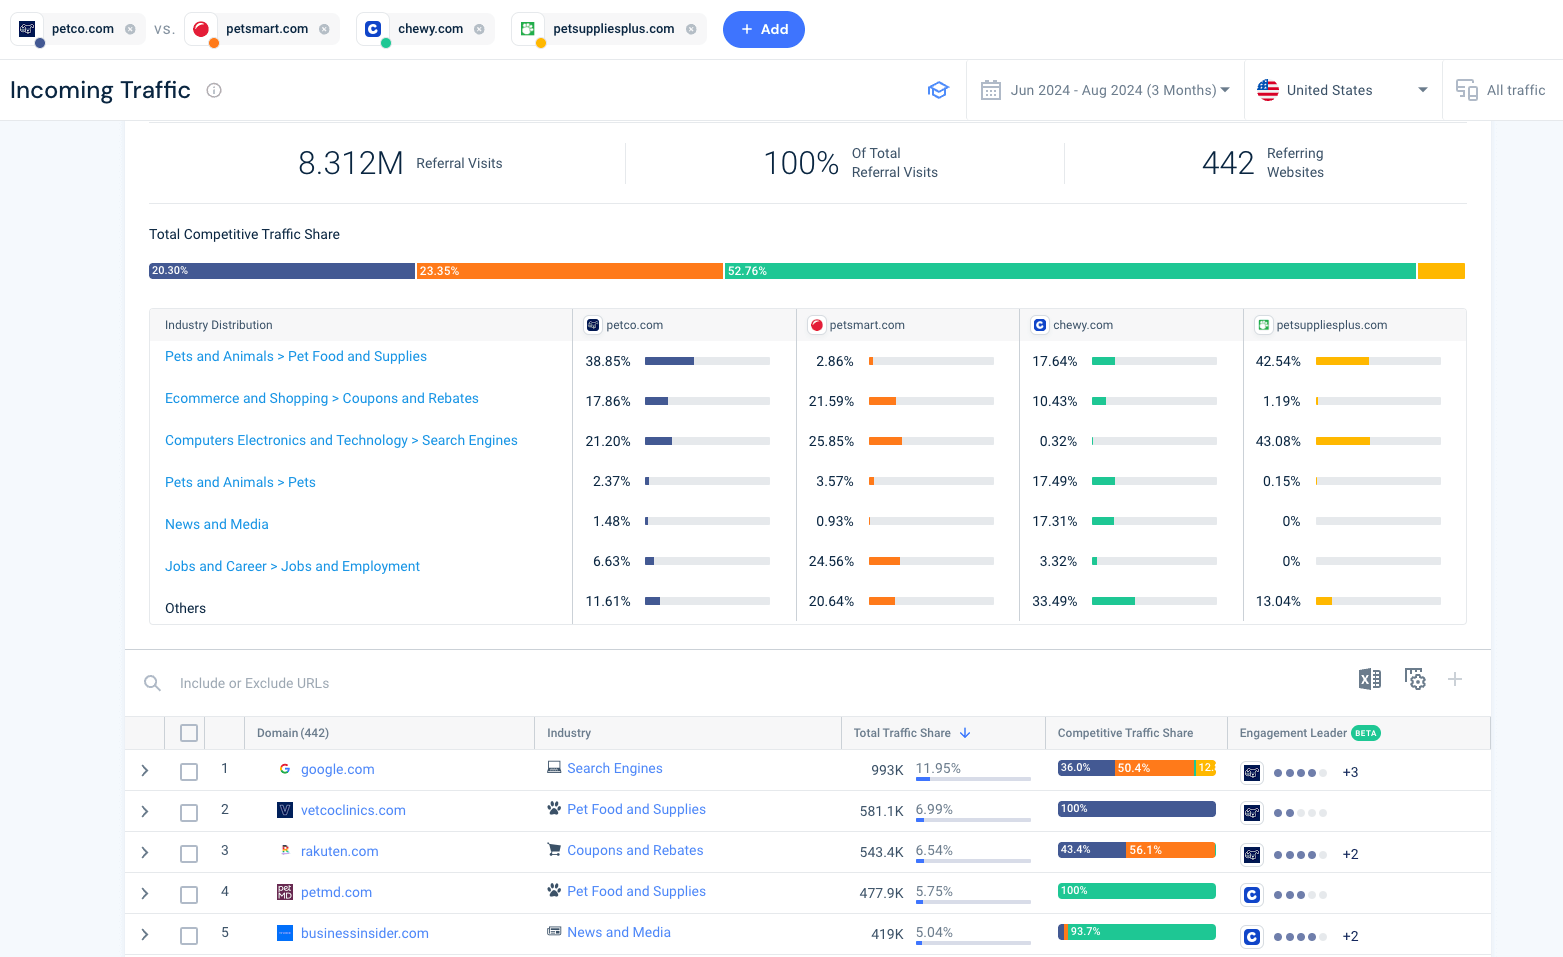
Patterns surface from accumulated data. Pricing moves that cluster before a fiscal year end, messaging shifts that precede launches: identifying patterns in large datasets is what separates intelligence from news, and it's where real-time data earns its keep. Accumulated insights compound; scattered notes don't.
Sharing across departments
Intelligence that stays in an analyst's head is a diary. Dashboards enable quick sharing of intelligence across departments: product sees feature moves, marketing sees campaign activity, executives get easy access to a summary of key competitor movements and metrics.
Collaboration features carry this further. Comments, tagging, and alerts routed by topic mean the person who spots something can hand it to the person who can act on it the same day.
Faster, better-grounded decision making
Access to shared evidence changes how arguments end across the business. Teams that once debated from opinion settle questions by opening the dashboard, and data-driven decisions replace the loudest voice in the room. Actionable insights carry the argument because anyone can check them.
The same access helps improve decision making at the top. Executives make informed decisions about pricing and roadmaps faster when the competitive intelligence behind the question sits one click away instead of one meeting request away.
Interactive analysis and custom views
Static exports answer yesterday's question. Interactive analysis and custom views let a product manager focus on two specific competitors and one feature area, while the CEO keeps a one-screen summary.

The same data serves both because the views differ, not the sources. That's the argument for one shared intelligence dashboard over five departmental spreadsheets scattered across multiple platforms.
Power BI or a purpose-built tool
When Power BI is enough
Power BI fits when the data already exists inside your business. If you have analysts, defined data sources, and pipeline records, financial data, and market share estimates to visualize, Power BI gives you custom views over large datasets with licensing your company may already pay for.
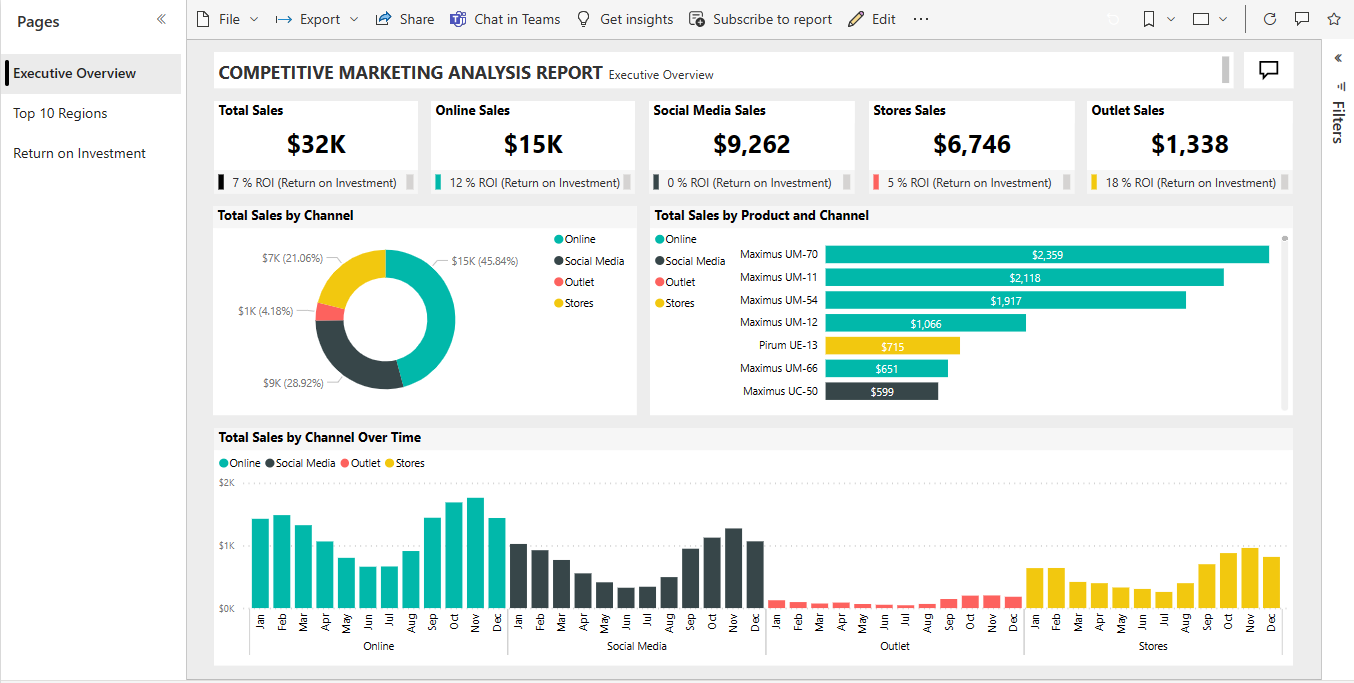
The limit is collection. Power BI charts what you load into it; it won't visit competitors' websites overnight or classify what changed.
When a purpose-built tool wins
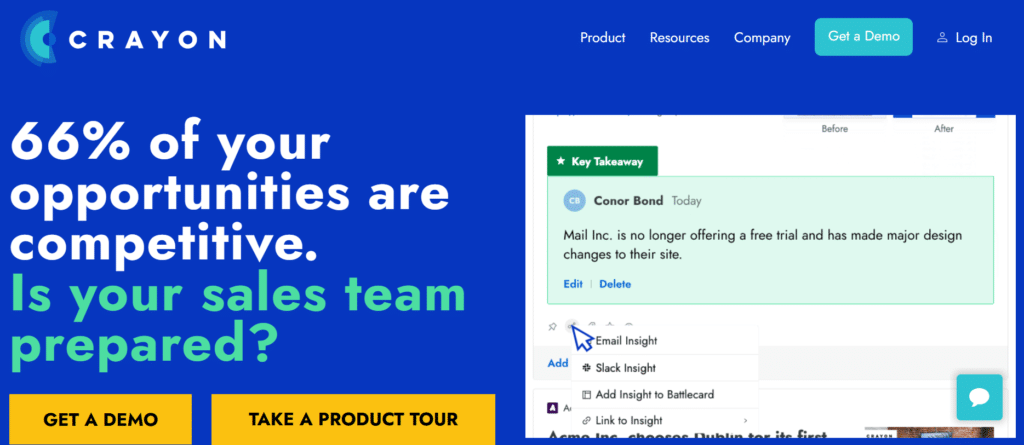
A purpose-built platform solves the collection problem. Platforms in this category crawl competitors' sites, social profiles, and press coverage on a schedule, classify each change, and filter the noise before a human sees the feed. Valona, one vendor in the space, claims coverage of 200,000+ sources across 115 languages.
Pick based on your bottleneck. If presentation is the problem, Power BI does the job; if collection is the problem, buy the tool instead of building one.
How to set up a competitive intelligence dashboard
Step 1: Pick five to ten competitors
Start with the names your sales teams hear in deals, then add one or two emerging competitors that aren't winning deals yet but are hiring like they plan to. Resist tracking everyone. Twenty tracked companies at shallow depth produce less intelligence than eight tracked properly.
Step 2: Define key metrics per audience
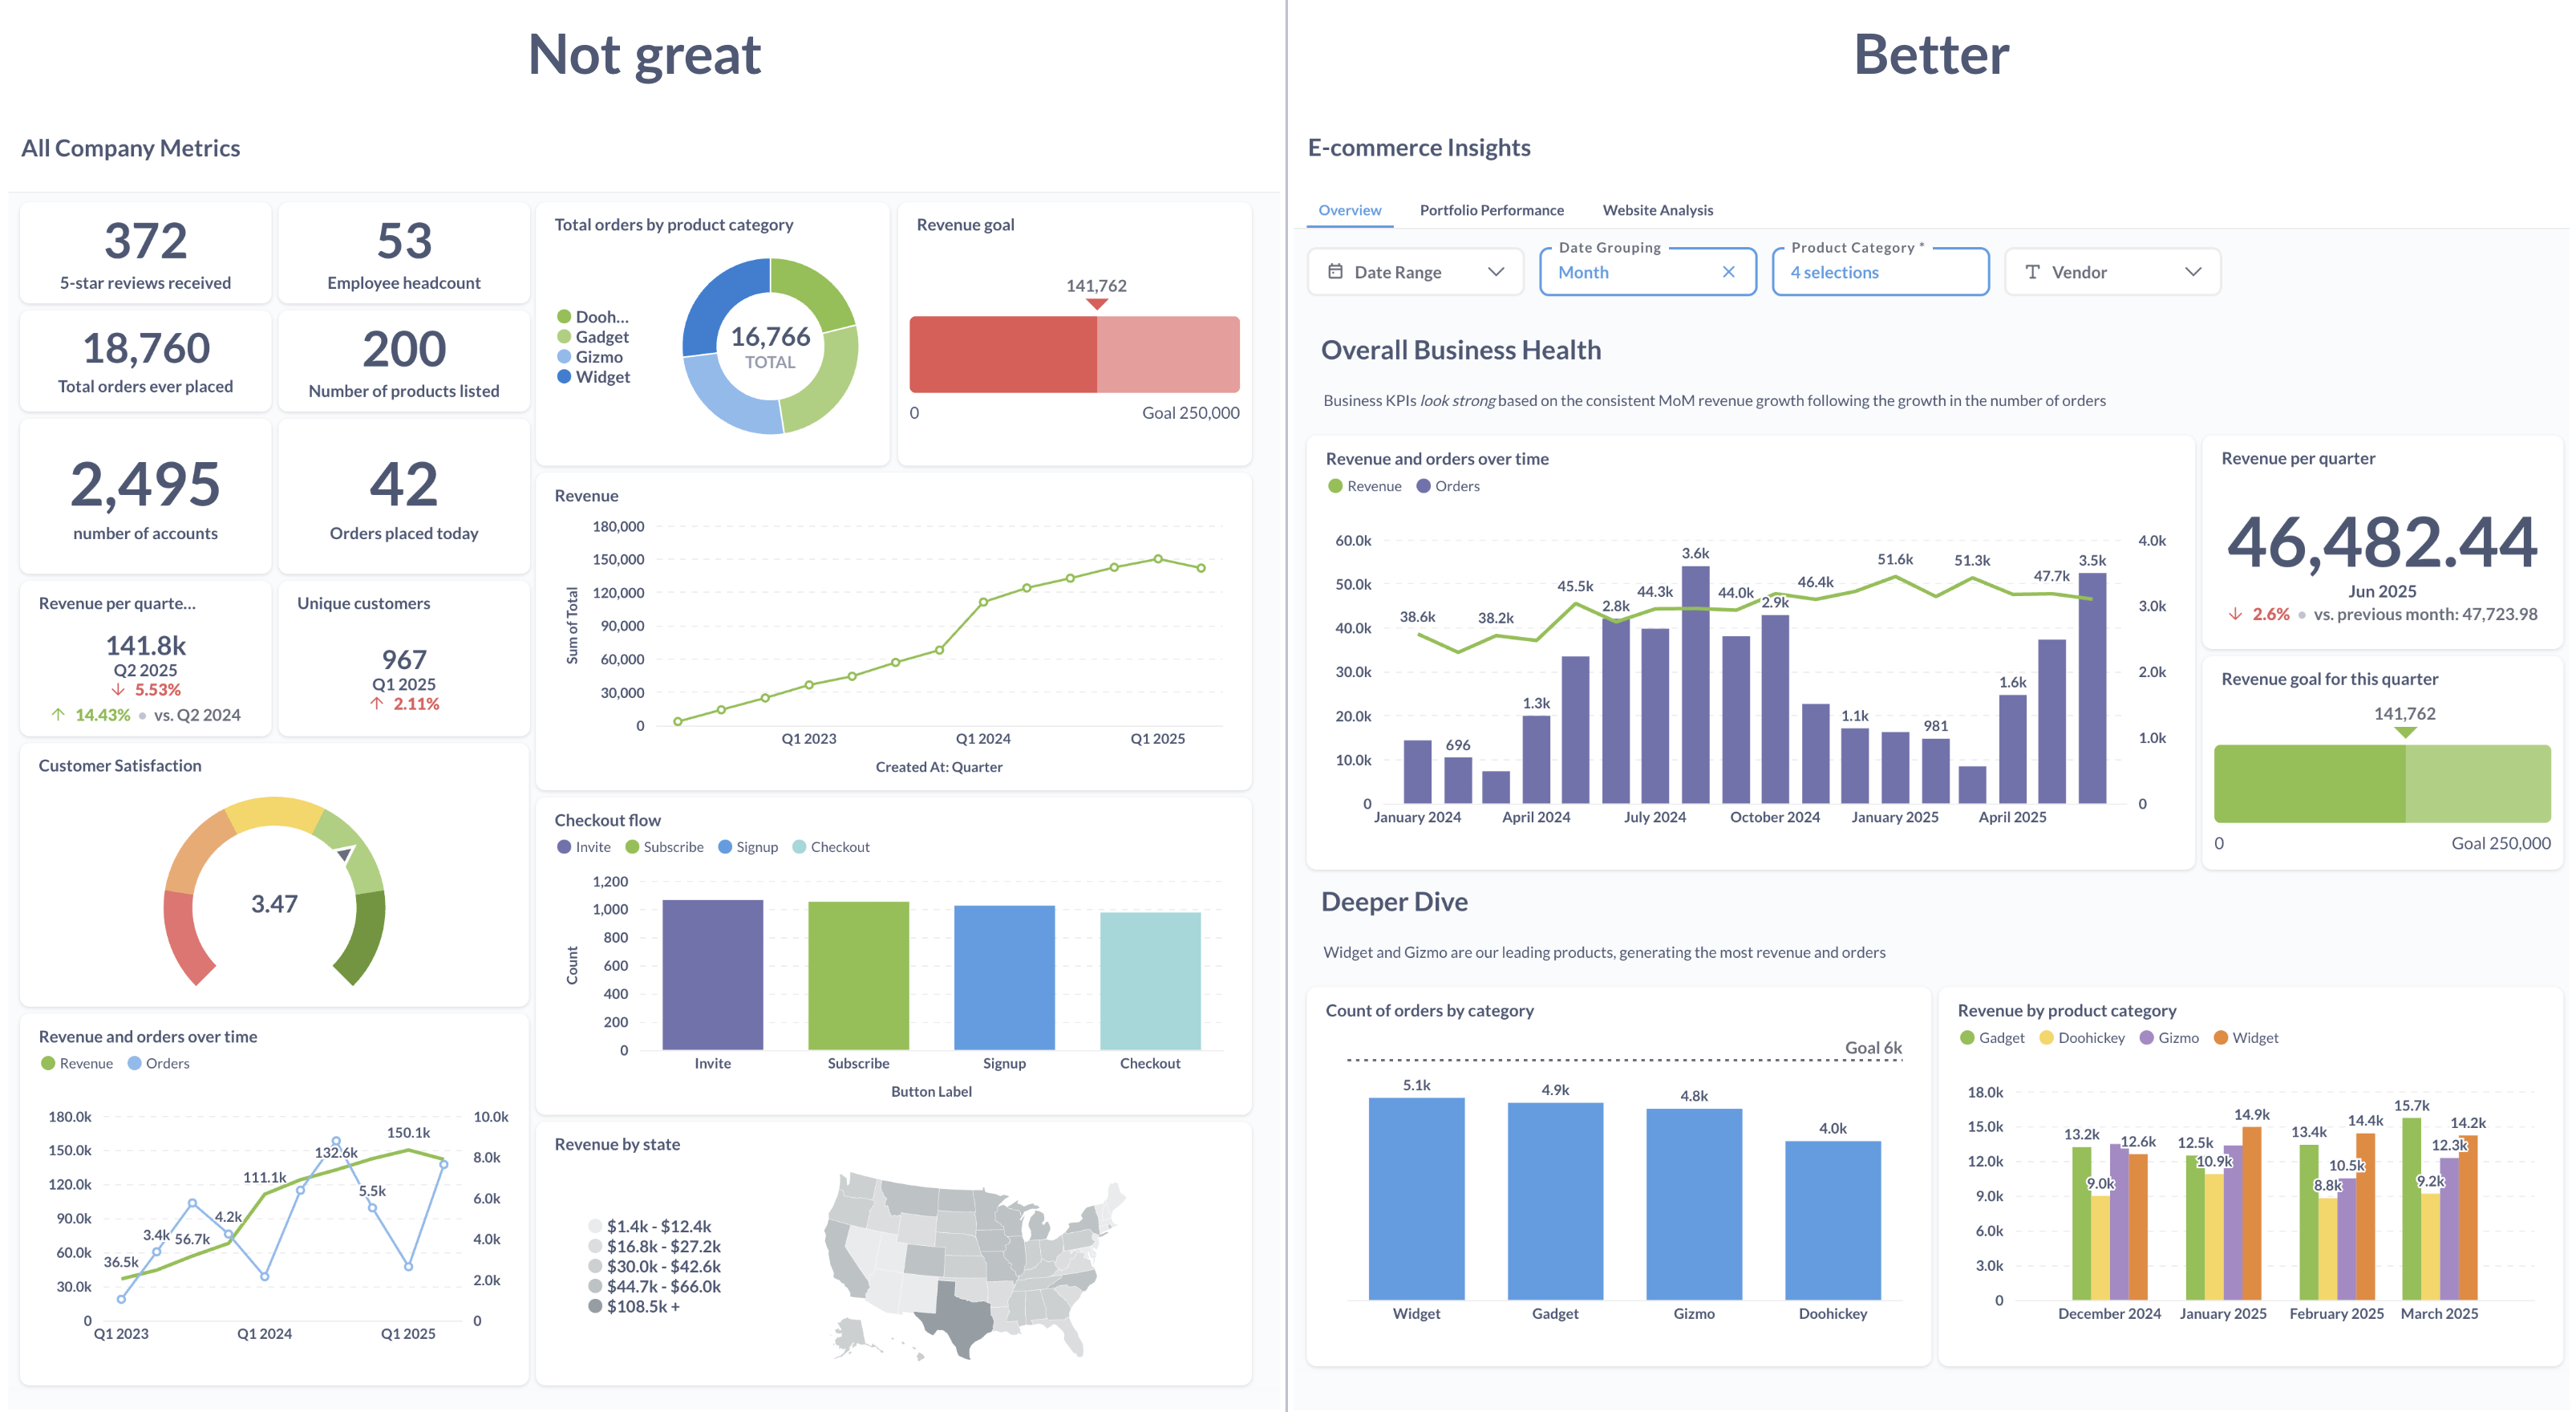
Each team needs different signals: pricing changes for sales, release velocity for product, share of voice per marketing channel for marketing. The test for every metric is whether it changes a decision. If it doesn't, it's decoration that blurs the dashboard's focus.
Step 3: Connect sources and set up filtering
Wire in the external sources first (websites, news, social, reviews), then the internal ones (CRM records, call notes, field intelligence from reps). Filtering turns raw captures into insights and matters more than collection volume. An unfiltered feed buries the one pricing change that matters under forty social posts that don't.
Step 4: Build views per team
Give each audience its own view instead of one screen that serves nobody. Sales gets battlecards, marketing gets campaign and channel comparisons, leadership gets a movements-and-metrics summary it can read in ninety seconds. Keep each view's focus narrow enough that opening it answers a question.
Step 5: Push intelligence into existing systems
A dashboard nobody opens changes nothing, so put the output where the company already looks. Dashboards integrate with tools like Salesforce and Slack: battlecards inside the CRM record, alerts in the channel where the sales team already argues about deals.
Step 6: Review what gets used
Check quarterly which views get opened and which alerts get clicked, then prune what's ignored. Usage is the only honest measure of whether the intelligence dashboard supports decision making or just decorates it. Track that number the way you track competitors.
AI in competitive intelligence dashboards
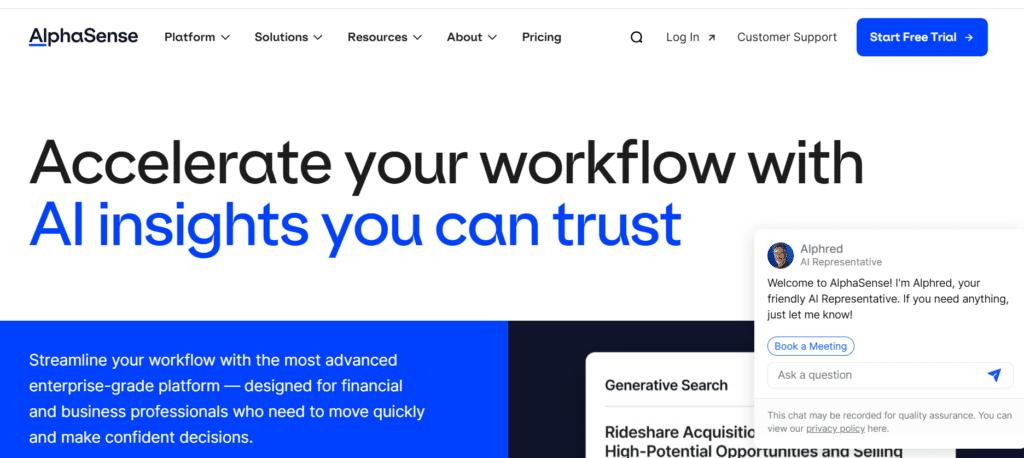
AI tools automate data gathering for competitive intelligence, and that's the least of it. AI also reduces time spent on manual data verification, the unglamorous work of confirming that a detected change is real, relevant, and correctly attributed.
Quality rises with the drudgery removed. AI improves the quality of competitive intelligence reports because analysts spend their hours on synthesis, context, and the insights that survive contact with a sales call instead of pasting large volumes of rows into spreadsheets. The reports read like analysis again.
From reactive to prescriptive reporting
CI reports evolve through stages. Reactive reports say what happened; predictive reports say what's likely next; prescriptive reports recommend what your business should do about it. AI enables predictive and prescriptive competitive intelligence reporting by processing more history than any analyst holds in mind.
Purpose-built AI platforms push reports up that ladder and raise their strategic value. A report that says a competitor raised prices informs; one that says they raise prices every Q4, so the renewal offer should land in October, earns its distribution list.
What to keep human
AI drafts; people decide. Summaries and classifications are safe to automate, but the call on how competitors' moves should change your marketing strategy still needs someone who knows your company's constraints and context.
Using the dashboard in your marketing strategy
A marketing strategy written without competitor context is a guess with a budget. The dashboard replaces assumptions about the competitive landscape with observed behavior: what competitors charge, where they advertise, which messages they repeat.
That grounding changes planning. Instead of debating what the market probably looks like, the team starts from what changed last quarter and builds the marketing strategy on top of actionable insights it can cite, not a remembered version of the competitive landscape.
The same discipline applies per marketing channel. A content strategy that ignores what competitors publish repeats them; a paid strategy that ignores their spend overbids them. Channel-level tracking keeps every part of the marketing strategy priced against reality.
Campaign planning
Marketing campaigns gain twice from the dashboard. Before launch, channel and keyword views show where opportunities exist because competitors underinvest; after launch, competitor monitoring shows whether any company moved to counter you.
Positioning gains too. Knowing which claims competitors already make keeps your marketing campaigns out of the pile of identical messages, and knowing their pain points (from reviews and win/loss records) tells you which contrast to draw in the next marketing strategy review.
Sales enablement
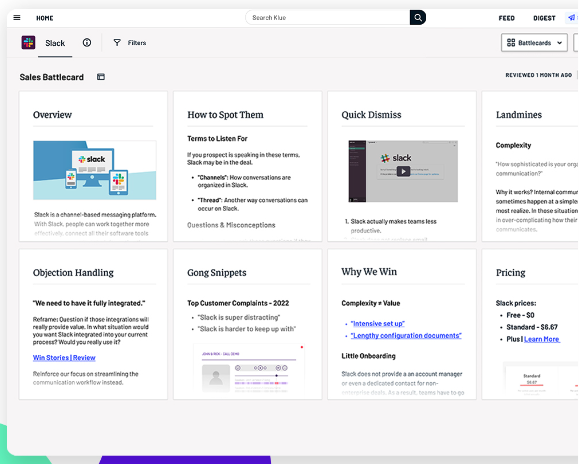
Sales performance improves when intelligence reaches reps inside the deal, not in a monthly email. Battlecards built from dashboard data give reps specific insights at the moment of the call: competitors' weaknesses, landmine questions, and pricing context. Marketing strategy sets the frame; the battlecard translates it for the field.
Competitive intelligence dashboards boost sales this way directly: insights into competitors' weaknesses win more deals than another generic pitch deck. The rep who knows the rival's users complain about onboarding asks one pointed discovery question and reframes the deal.
Product and executive use
Product teams read the dashboard for feature moves and gaps against competitors' products. Executives use it for informed decisions on strategic initiatives: entering a segment, adjusting pricing, or timing a launch against the market changes the data shows.
The same feed protects focus. Leadership that can see the competitor landscape at a glance spends fewer meetings relitigating what competitors are doing and more on the company's own strategy.
Common dashboard mistakes
The most common failure is tracking everything. Feeds fill with noise, people stop reading, and the one signal that mattered scrolls past unread. Focus on key areas beats coverage every time.
The second failure is having no owner. Dashboards without a named owner drift out of date within a quarter, and a stale dashboard is worse than none because the business trusts it while it's wrong. Strategy built on stale data inherits the staleness.
The third is skipping the baseline. Without tracked history, every move by competitors looks new and alarming. With it, most turn out to be repeats of an established rhythm, and the new ones stand out on their own.
The last is hoarding. If only the CI analyst has access to the insights, the company makes the same unsupported calls it made before buying the tool. Wide access with per-team views, plus a shared view of competitive positioning, is the fix.
Frequently asked questions
How is market intelligence different from competitive intelligence?
Market intelligence covers the whole arena: buyers, regulation, market trends, and pricing dynamics across an industry. Competitive intelligence is the subset focused on competitors, their moves, and their strategy. Most dashboard platforms handle both, and the valuable insights come from analysis that reads the two together.
Does a small business need a competitive intelligence dashboard?
A small business faces the same competitors with less slack to absorb surprises, so the case is stronger, and the setup is smaller. Track three to five competitors through free tools and a shared sheet before the company pays for a platform; upgrade when manual tracking starts slipping and the marketing strategy needs channel-level evidence. Keep access wide even at that size.
How fast does dashboard data update?
BI tools refresh on whatever schedule your data loads allow, while CI platforms crawl daily and push real-time insights for changes that can't wait, like pricing. Either way, a revenue-relevant change should cross the company in hours, not weeks.
Which teams should get access?
Sales teams, marketing, product, and leadership each get their own view; access should be wide and the focus of each view narrow. The dashboard pays for itself when competitive insights stop being one analyst's inbox and start being the company's shared record of the market, feeding data-driven decisions in every department and keeping the marketing strategy honest.